Author: admin

  • Grand Final, 2025

    Grand Final, 2025

    This Week In Football is a collection of some of the best in football currently outside the walls of AFL clubs or broadcasters. Each week a curated grab bag from regular contributors and special guests will provide insight into and beyond the game on subjects of their choosing. For more about our contributors, click here.

    Banner images by Polly Porridge of the True Bloods Podcast. Check out her other design work.

    Before the Bounce

    It’s finally here.

    After a long and grueling season the final men’s AFL game for 2025 is at our doorstep.

    While there’s still a lot of great AFLW games left this year, a granny is special regardless of the level.

    The match-up is a mouth watering one. In one corner stands the reigning premiers, the other the best team across the course of the year.

    Just four quarters to sort out who will be crowned the champions of the year. Just four quarters of the most important footy of the year left to enjoy.

    So make sure you are around the people you like watching the game with, in the place you like doing it the most (except if that place is the MCG if you don’t have tickets). Let’s hope we have a classic like 2018 or 2023 on our hands.

    This week in football we have:

    This will likely be the second last edition of TWIF this year. Closer to the end of the year there will likely be a TWIF Year In Review edition compiling the best of 2025.

    Thank you sincerely to all those who subscribed, read, share and most importantly wrote for TWIF.


    Grand final preview

    Images – James Ives. Words – Cody Atkinson and Sean Lawson

    This preview will contain excerpts of items Cody and Sean have written about

    Image: James Ives

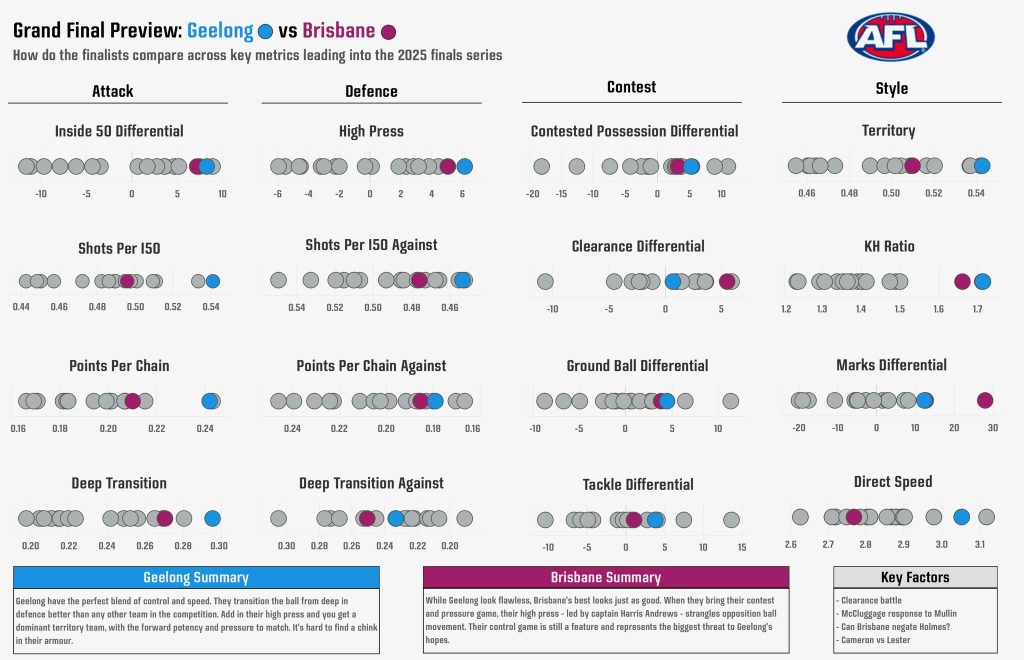
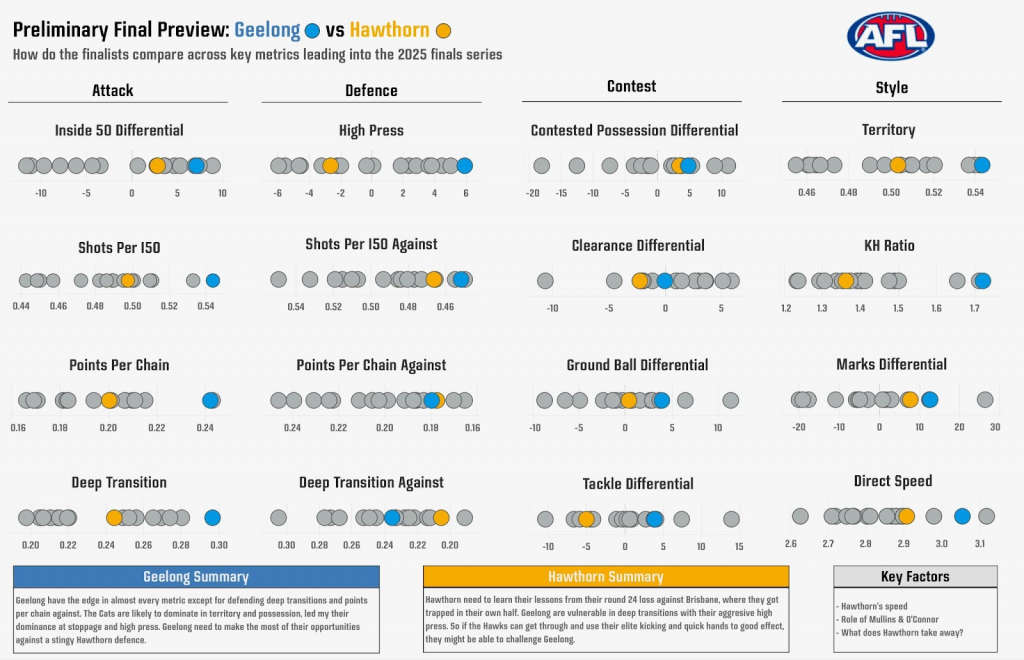
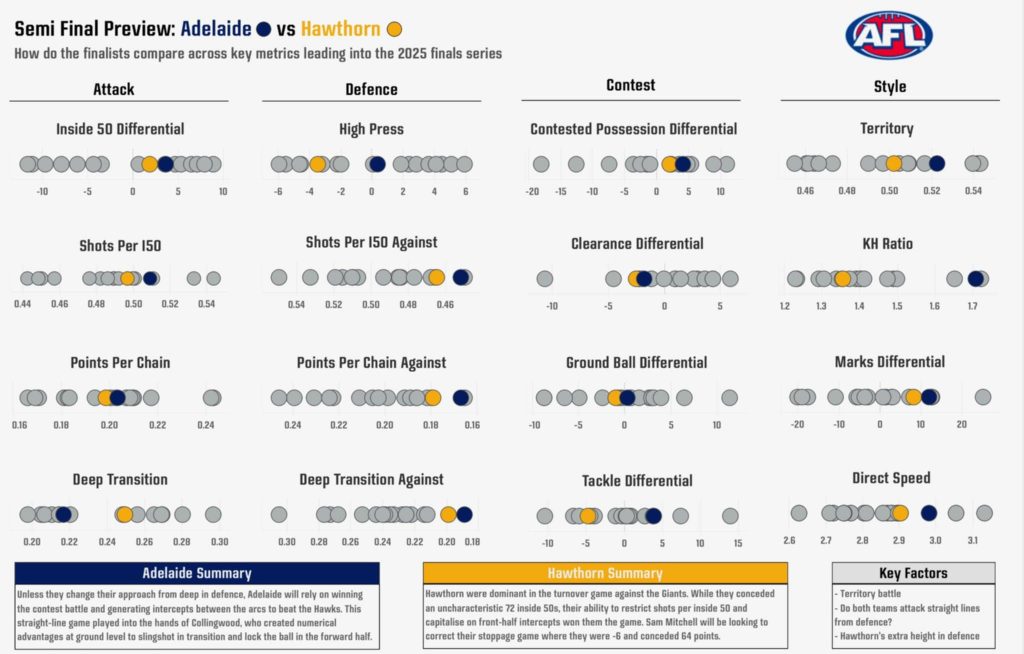
    Similarities present themselves between the two sides. Both have a kick preference, and work best in the kick-mark game. Both press high for intercepts, and like to try to dominate territory to instead of maximizing efficiency.

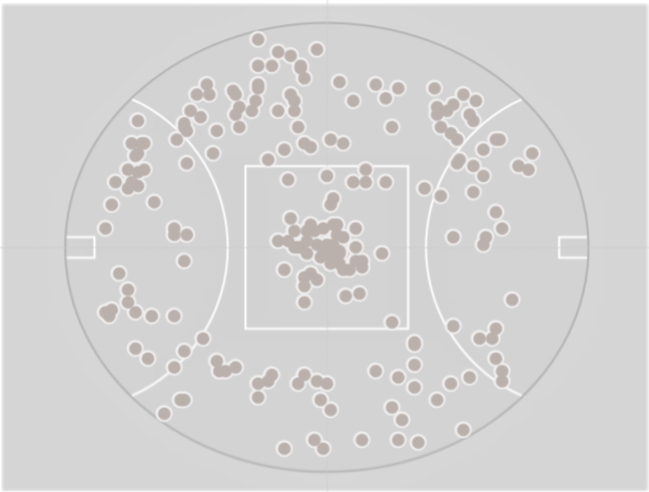
    A Lions game sees them controlling play by executing kicks to uncontested marks around the ground. No side takes more uncontested marks than the Lions, and only two prefer to kick rather than handpass more (Geelong and Adelaide).

    There are differences however. The Cats play noticeably quicker than the Lions – with a few important caveats.

    “They are certainly a team that can shift the ball, they’re also a very powerful go-forward team with speed, so you know they can do it multiple ways,” Melbourne coach Simon Goodwin said after his side’s round-four loss to Geelong earlier this year.

    …This malleability is at the heart of the Cats’ success this year.

    They switch up the speed at which they move the ball on a week-to-week basis as much as any other team.

    The Cats can shift modes with ease and possess several core elements designed to put opposition sides off their game.

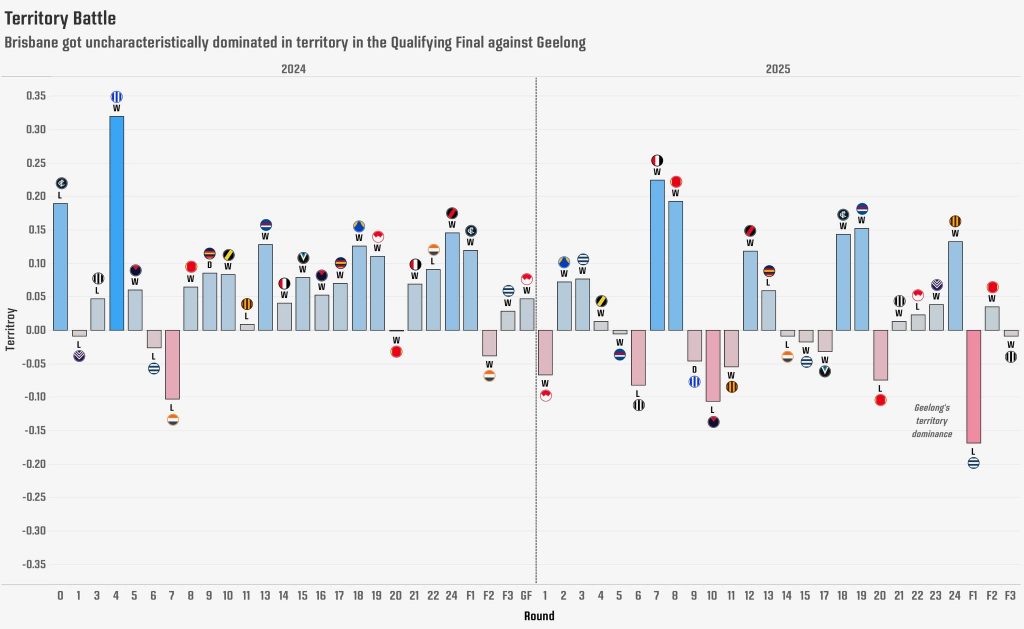
    The Lions also try to establish the corridor as a cornerstone of their success.

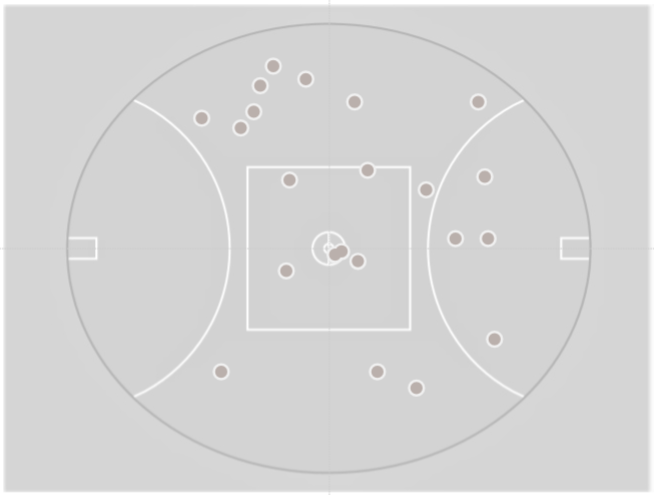
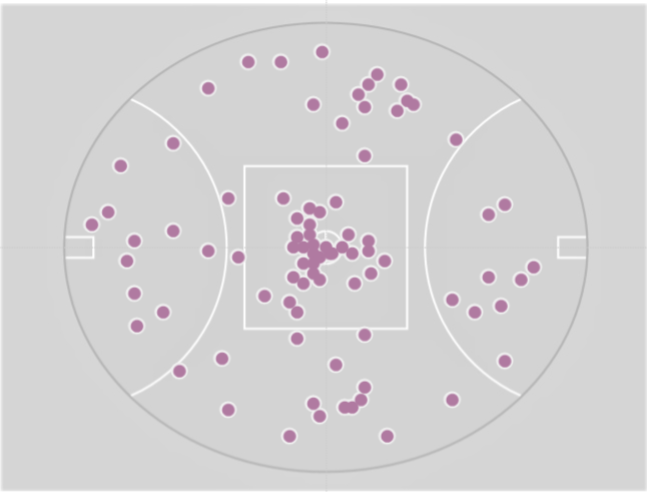
    In their two wins against the Cats earlier this year, Brisbane forced the game through the middle about 50% more than an ordinary game. This opened the Cats defence up in a way that few other sides have been able to do this year. It’s also noteworthy that the Cats have struggled against the Giants, another side to target the middle of the ground.

    In the qualifying final, the Cats went to a lot of effort to not only stop the Lions going through the middle, but to avoid the corridor themselves. When a side uses the guts of the ground it can also open you up for a quick counter attack the other way.

    Image: James Ives

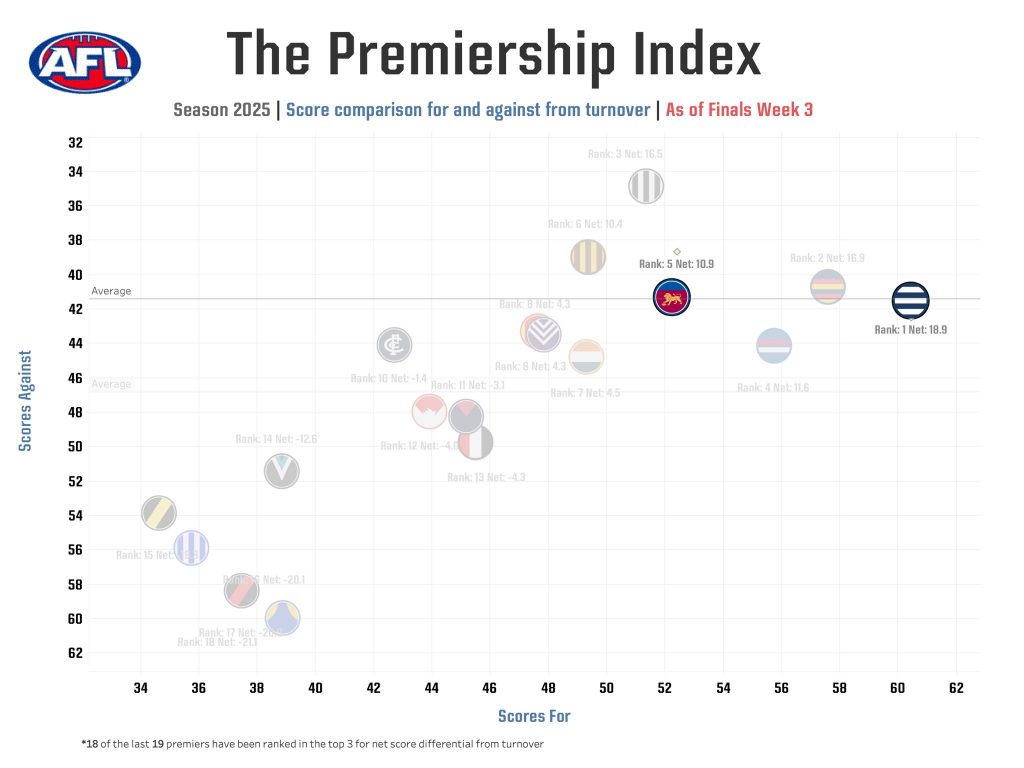
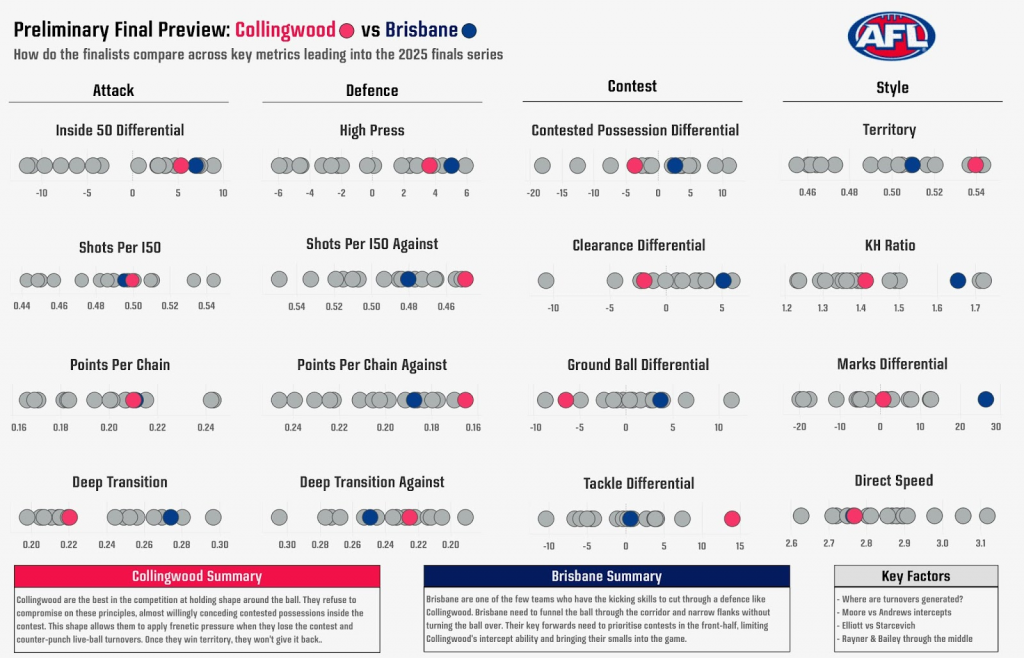
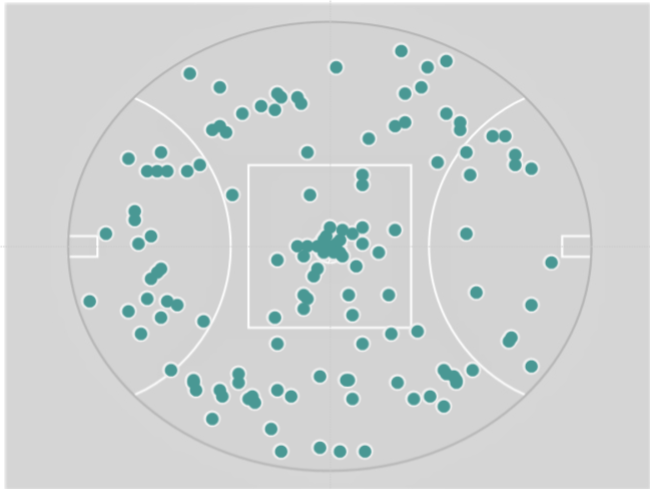
    In every game of modern footy the turnover game is critical. About two thirds of scores come via turnovers. And no team is better at playing that game than the Cats.

    No team is better at winning the ball and using it effectively than Geelong.

    The Cats lead the league from scoring from intercepts across the course of the season. 

    Teams that have finished top three in total intercept scoring differential have won the flag in 18 of the past 19 seasons. 

    While the Cats lead the league in that number (by some way), Brisbane are only ranked fifth across the year.

    Image: James Ives

    The Lions need to get their clearance game working to get an edge.

    Across the course of the year getting first possession — and the territory from it — has been key to how the Lions have succeeded. The Lions sit second throughout the season for clearance differential behind only the Western Bulldogs. Almost all of this advantage comes around the ground, with the Lions deep midfield group benefited by being able to deploy additional numbers around the ball.

    In addition, getting reward from clearances is critical to their success.

    Zac Bailey leads the league in scoring out of forward stoppages, but is far from the only contributor. Brisbane runs deep up forward, with a wide variety of first receivers and deeper targets.

    Both sides have players that step up in the big moments.

    Image: James Ives

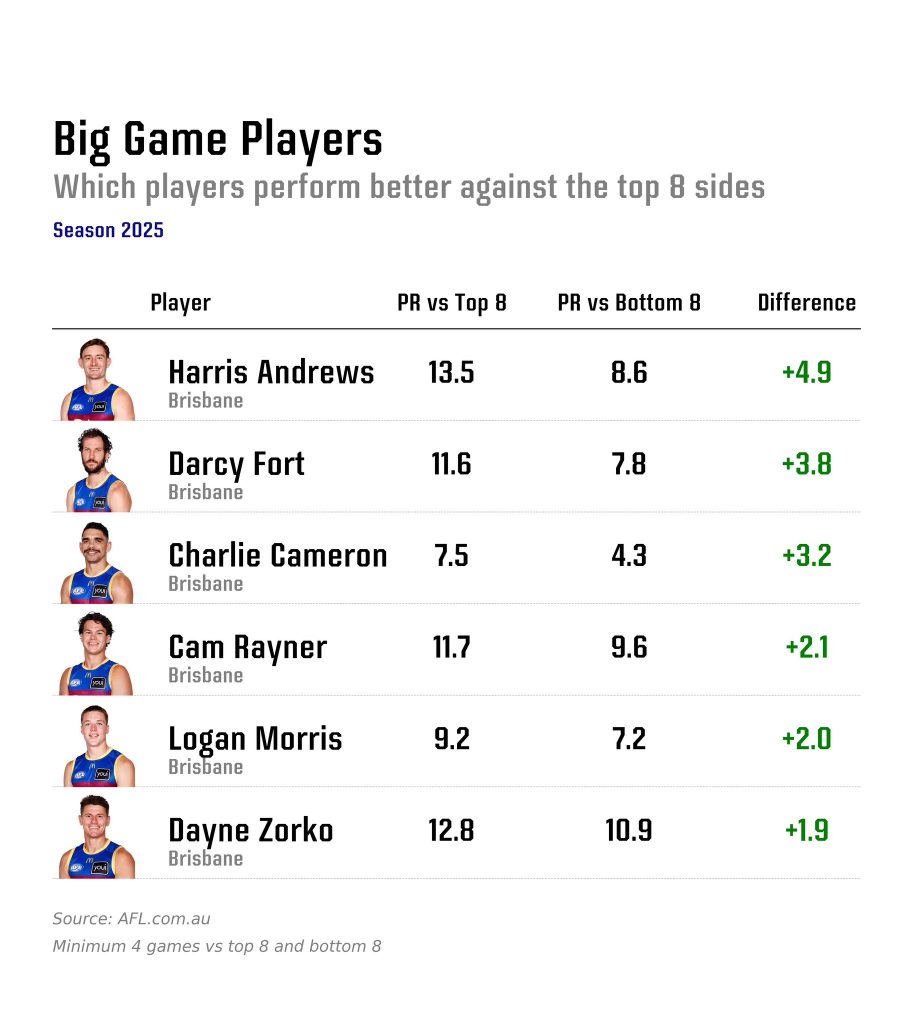
    For the Lions their captain stands tallest of all, anchoring the side to (usual) victory. There are quite a lot of names prominent in the front half of the ground alongside the attacking Zorko. If the Lions are to win, one of these six will have a large part in the result.

    Image: James Ives

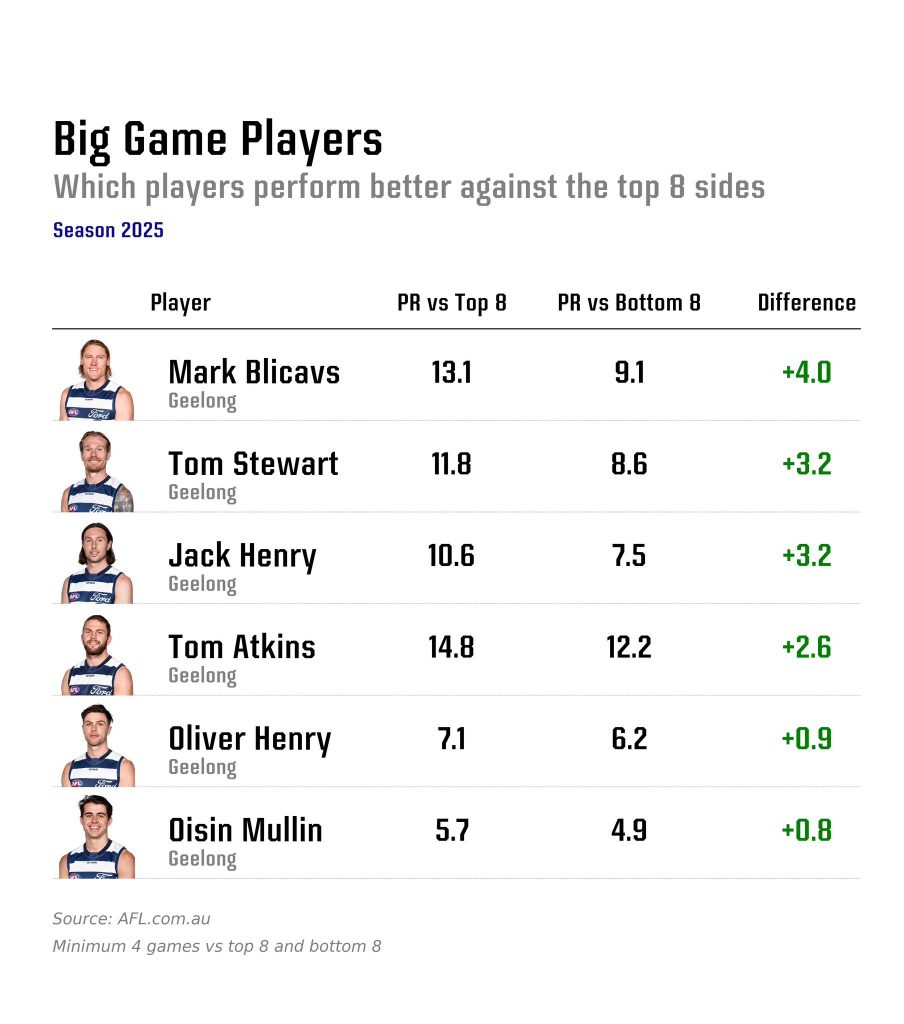
    Mark Blicavs still doesn’t get the credit he deserves much of the time. The Cats are a much more even team against both good and bad sides. Noteworthy in this list is the presence of Tom Stewart who will miss the Grand Final with injury.

    Now all that’s done, bring on the big game!


    A Brief History of 129 years of the Cats and Lions

    Emlyn Breese / CreditToDuBois.com

    Given the upcoming Grand Final this week it’s worth taking a look at the cumulative results of our two grand finalists over the last 129 years of A/VFL competition. Instead of breaking down every match, this is a look at the result of ever game.

    Think of it as a score worm like you’d see on the AFL Match Centre, but one that uses the endpoint of one match as the starting point for the next.

    The Lions have been represented as a continuation from Fitzroy to the Brisbane Lions for the purpose of the main chart, but there’s a supplementary Brisbane Bears v Cats chart as well in the carousel below.

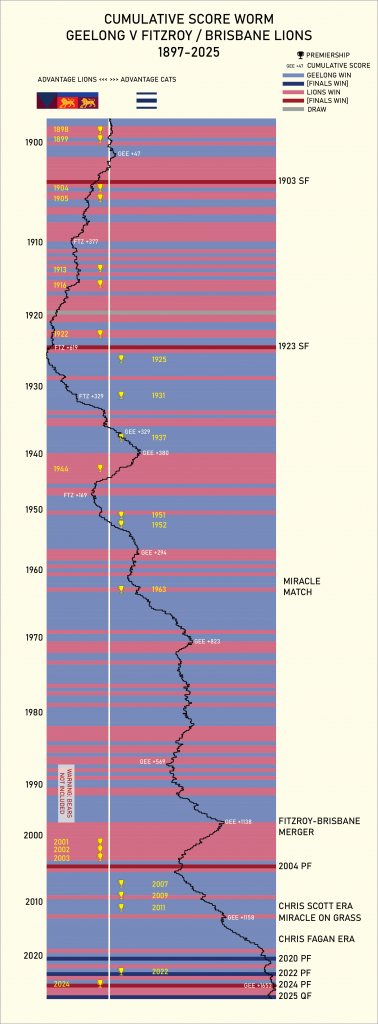
    The history of the match-up has been broken into four eras with a very brief summary of each. To see each you can scroll through the interactive graphic to follow the history, or you can access at a separate standalone page here.


    How the Grand Final lists were built

    Sean Lawson

    Brisbane and Geelong have been perennial contenders in recent years, but there’s a strong contrast in how the two grand finalists have built their lists.

    There are broadly three ways clubs can acquire players.

    The national draft is the primary conduit, where the most well regarded players must be selected in an orderly competitive process in their 18th year or later (overlooked players from previous drafts can be selected as well as some other caveats).

    The second method is recruitment from other clubs. These are trades and free agency moves where there are conditions and reciprocal agreements required for a player to move are met. This is, again, a competitive process among clubs, who generally don’t like losing many of the players who request moves.

    The third method is the various “freebies” pathways. These are for players who were basically available without much external cost having already been discarded or passed over. This includes the rookie draft, delisted free agency, international players and players “not from a football background”. These players could have been taken by anyone, with the challenge for clubs usually just identifying who is worth taking.

    List formation is always a combination of recruiting pathways, but the Cats and Lions have done it very differently.

    Geelong

    If we can answer why Geelong have stayed in contention for two decades in a phrase, it is talent identification.

    Geelong only have four native high draft picks in their grand final team, and only Jhye Clark was taken in the top ten.

    They’ve also got a high quality trio of players pinched from other clubs in Patrick Dangerfield, Jeremy Cameron and Bailey Smith. All were arguably recruited partly for lifestyle reasons as well as due to the club’s sterling reputation. Rhys Stanley and Jack Bowes also came via trades – with the Bowes one particularly controversial as a generous Gold Coast salary cap dump.

    But a few stars don’t make a team, and much of the Cats list, and much of their success, is filled out by players taken from obscure places. They have ten players who anyone could have recruited – six from rookie drafts, two delisted free agents in Stengle and Martin, and the two Irish imports.

    Throw in relatively late picks like Miers and Humphries and we can say that nearly two thirds of this Cats team were recruited from savvy recruitment and talent identification that must have list managers across the league looking on with envy.

    Brisbane

    Before their current period of contention, the Lions languished at the foot of the ladder for most of the 2010s. During that time they stocked up on high draft picks.

    The bulk of their team was built from the national draft, including six high draft picks. Rayner and McCluggage in particular are the sort of blue chip selections that paid off handsomely, essential to any good list rebuild.

    They Lions have also been lucky enough to have three premium level father-sons, and several later selections came out of their academy in Andrews, Gallop and Marshall.

    The balance of the Lions team has been made up of traded players, including Neale, Cameron and Dunkley who cost first round picks in their own right.

    Only two Lions players came from “freebie” pathways, with both Reville and McInerney coming via the rookie draft. Reville isn’t strictly a “freebie” – he’s an academy pick who was prelisted by the Lions, but he was still overlooked at the National Draft.

    The Lions have tapped many years of premium draft picks, and converted those selections into a formidable team.

    Battle of the local talent

    This year’s match-up features a number of hometown heroes on both sides, but also players who have crossed the borders too play for the other team.

    Nine Queenslanders feature for the Lions, ranging from heavy hitters like Will Ashcroft, Dayne Zorko Harris Andrews to the fringe pair of Ty Gallop and Bruce Reville. Geelong are also fielding Jack Bowes, a Queenslander who began his career at the Suns.

    On the flipside, Geelong have managed to secure a few quality local talents through the open draft, principally Jhye Clark and Gryan Miers, as well as rookie selections Tom Atkins and Jack Henry.

    There’s surprisingly only one player lured “home” from another club, but Patrick Dangerfield is such a mammoth presence he is emblematic of the “go home” set by himself. Jeremy Cameron is a country boy too, but being from far flung Dartmoor, it’s a stretch to count him as a local.


    Tackling the Brownlow

    Joe Cordy

    Matt Rowell’s Brownlow Medal win came out of nowhere, but with the power of hindsight it was also wholly in line with how the award has been trending.

    The Suns’ defensively-minded inside midfielder doesn’t jump off the page in any of the typical metrics people use to predict how the votes are going to fall.

    Rowell doesn’t regularly rack up massive disposal counts and he doesn’t make immediate obvious impact by foot with the disposal he does win. Even his highlights packages are pretty sparse for his standing in the game. These things are the domain of the pre-count favourite Nick Daicos, and his teammate Noah Anderson who was widely tipped to be the only Suns player with an outside chance of topping the vote tally. 

    What Matt Rowell does have is something that isn’t considered much by punters, or even the predictive models that have emerged in the last few years: he is constantly, visually, in front of the umpires. 

    With 61 free kicks paid against him and 53 paid to him, good for 1st and =4th across the league, Rowell was the only player to be directly involved in over 100 free kicks across the season with a final total of 114. 

    Australian Football is a physically exhausting sport to adjudicate, with field umpires running approximately 14km per game and boundary umpires 16km. Everybody knows this, but few people take into account the mental exhaustion.

    The PGMOL – who are responsible for referees across English professional football – estimate their referees will make 245 decisions per game. In the NRL the estimate has been put around 400 decisions per game, and the NBA quote a range of 500-550.

    In 2021 the-then umpires boss Hayden Kennedy estimated that in the 30 seconds of play around a stoppage, where possible infractions are at their densest, an umpire might have to make 10 to 20 decisions.

    With a league average of 97.7 stoppages per game, that would put the decision count in a range of 977 to 1,954 decisions just around stoppages before even considering the rest of the game. Even with this mental load split between four field umpires, it’s a total that dwarfs most of their colleagues in other sports.

    It makes total sense that when put in the position of having to decide who they thought the best three players were immediately following that gauntlet, while also being put in a Rawlsian veil of ignorance about the statistics of the game just played, the umpires continuously fall back on two main factors:

    • who did I see a lot of, and
    • who do I usually give votes to. 

    In the AFL era this burden has massively increased, even as the system stayed untouched since the early 1980s. Six votes split amongst three players for each game, decided on by the group of umpires on the day.

    In 2025 there are more games, teams, players and therefore votes to be spread around the league than at any point in the AFL era. Despite that, the spread of distinct vote winners in a given season has trended consistently downwards over the last 35 years.

    2025 had the narrowest field since 1990, with just 181 players receiving at least one vote. The previous record of 196 was set in 2024.

    If you took a poll of every fan’s opinion of who the best player in the league was at the end of each season since 2020, I’d expect the most popular answers would be overwhelmingly Marcus Bontempelli and more recently Nick Daicos. Bontempelli’s window might well be closed, and despite having won an individual award every year of his career so far, Daicos was visibly frustrated with the reality of a third consecutive second place finish. 

    This isn’t because the umpires think either of these players are terrible despite the consensus of the wider footy community, Daicos’ 38 votes in 2024 would have won almost any other year in the award’s history. They’re just not the kind of players whose profile puts them at the front of the umpires’ mind week after week. 

    There’s been a lot of discussion in light of this and other controversial calls like Nasiah Wanganeen-Milera’s BoG snub to take the votes off the umpires, which I think is completely wrongheaded. Awards are only worth the importance the footy community puts on them, but that importance is built up over decades of history.

    What makes it special is that it’s been awarded for over a century, and has been largely unchanged across that time. Even though the voting system has changed (albeit not in the last 46 years) it has always been determined by the umpires; taking it completely off them would effectively end that history, and even an award with the same name would have no real basis for comparison to anything in the 100 years previous to it. 

    There’s absolutely room for more Player of the Year style awards as the AFLPA and AFLCA have shown, and I believe there’s even room for another American-style MVP voted on by members of the football community from the media, clubs, and elsewhere.

    The answer for how to move forward with the Brownlow however isn’t to completely kill it and give something else its name, it just needs to evolve with the sport. Give umpires time to recover from and digest the game they just saw, give them access to statistics and footage, and then ask for their votes in the cool light of day. The Brownlow is the most prestigious award in Australian Football and likely always will be, so there’s no reason to artificially constrain the people voting on it.


    Poor Nick Daicos, polling exactly as expected

    Liam Crowhurst

    The Brownlow Medal is one of my favourite puzzles. The arcane voting methods and the lopsided sample sizes create a data science challenge that I’ve been enamoured with for the last couple years, and the 2025 certainly threw up some curveballs.

    There’s a lot of different ways you can work out who will win the Brownlow. Some rely on their eyes, some on their gut and some on the best data available.

    My chosen method of modelling the Brownlow is as follows:

    • Train a XGBoost model on player based statistics. This includes Coaches Votes, SuperCoach, Fantasy, AFL Player Ratings, along with more basic stats like game margin, goals kicked, disposals etc. The model is a classification problem, using the training data from 2015 to 2024 to predict the likelihood of a player getting 3, 2 or 1 Brownlow Votes.
    • From these outputs, a simulation is used to select players for each vote category per game. Once a player has been picked for 3 votes, they are excluded from the sample. This process is then repeated for the 2 and 1 vote. The entire process is then repeated for every game in every season 10,000 times. This should give us a good sample size for predictions, as each simulation will be independent, but weighted towards the higher expected vote getters.

    So how does the model compare to the actual results on the night?

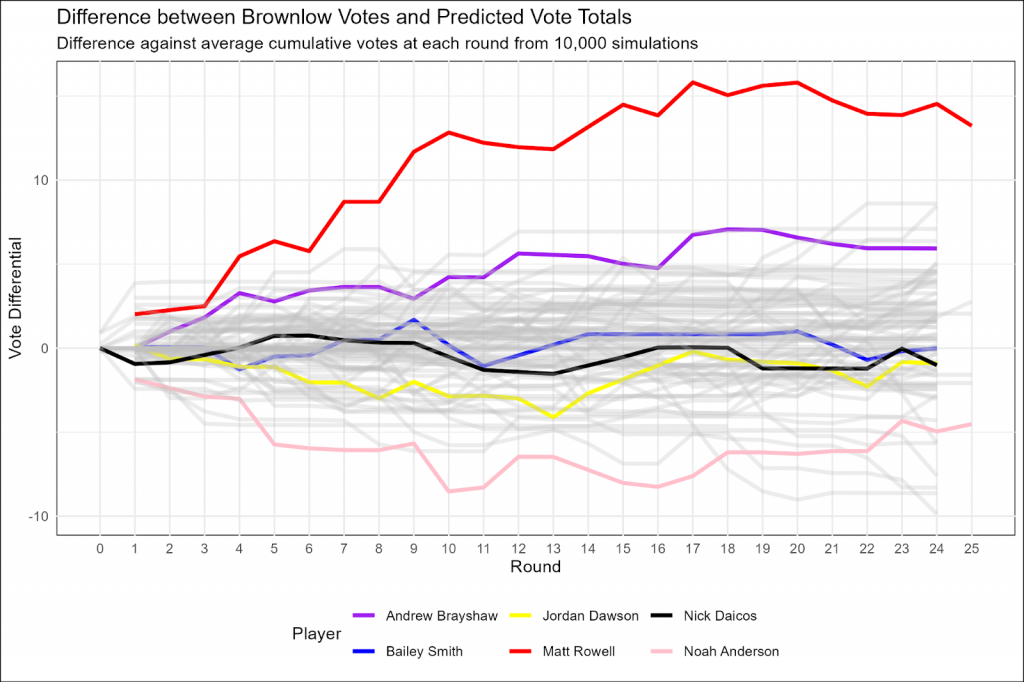
    Let’s look at the favourite Nick Daicos as a demonstrative example.

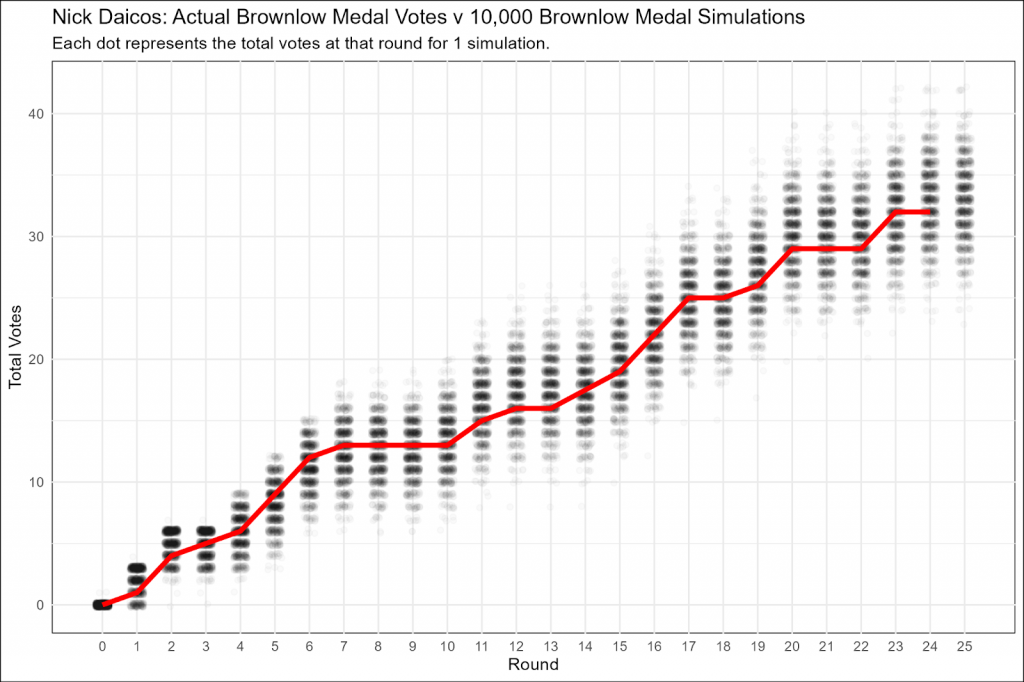
    As you can see above Daicos polled exactly as predicted. His actual vote trajectory as the tally went on was well within the simulated range of votes. Across 10,000 simulations the model expected an average of 33 votes against a total of 32. In summary, the model was in the ball park of expectations for Daicos.

    However, there was one player that smashed it out of the ballpark. Matt Rowell polled over expectation early and never looked back. The model predicted 25.8, but he polled 39 votes. That’s a whopping 13 votes above expectation.

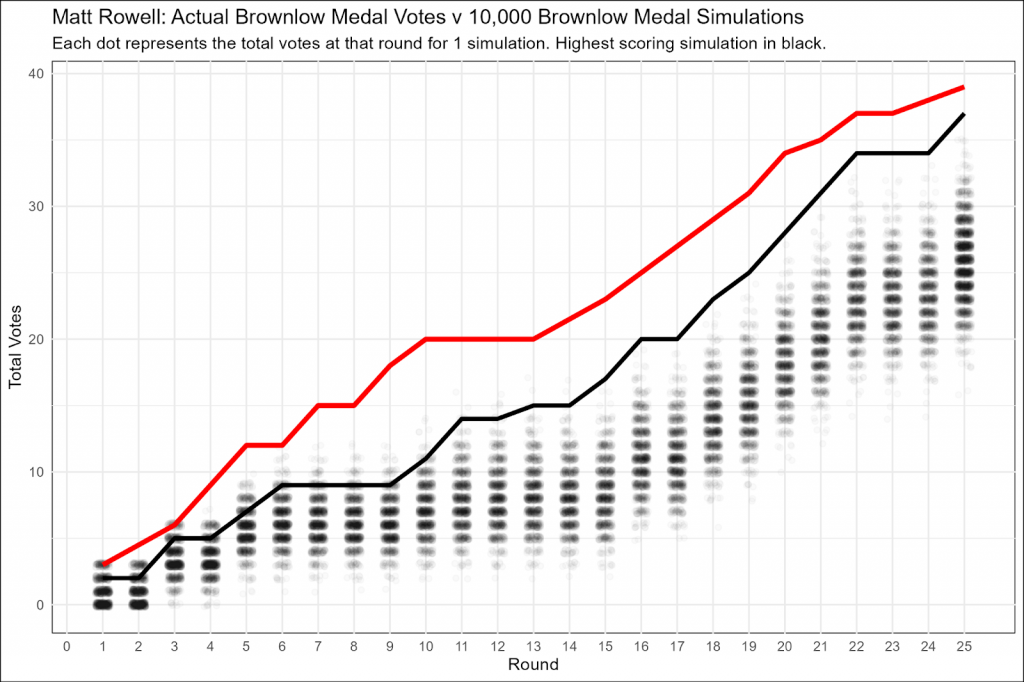
    The highest simulation that the model predicted was 37, outlined in black below. I reckon with another 10,000 or so simulations we could find one with 39 votes.

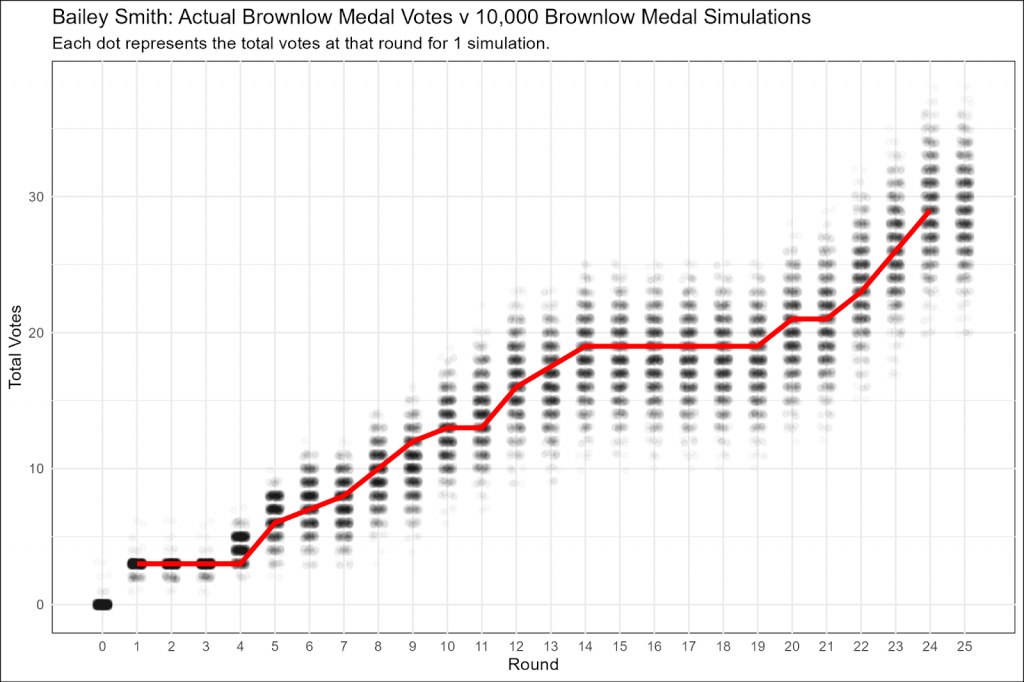
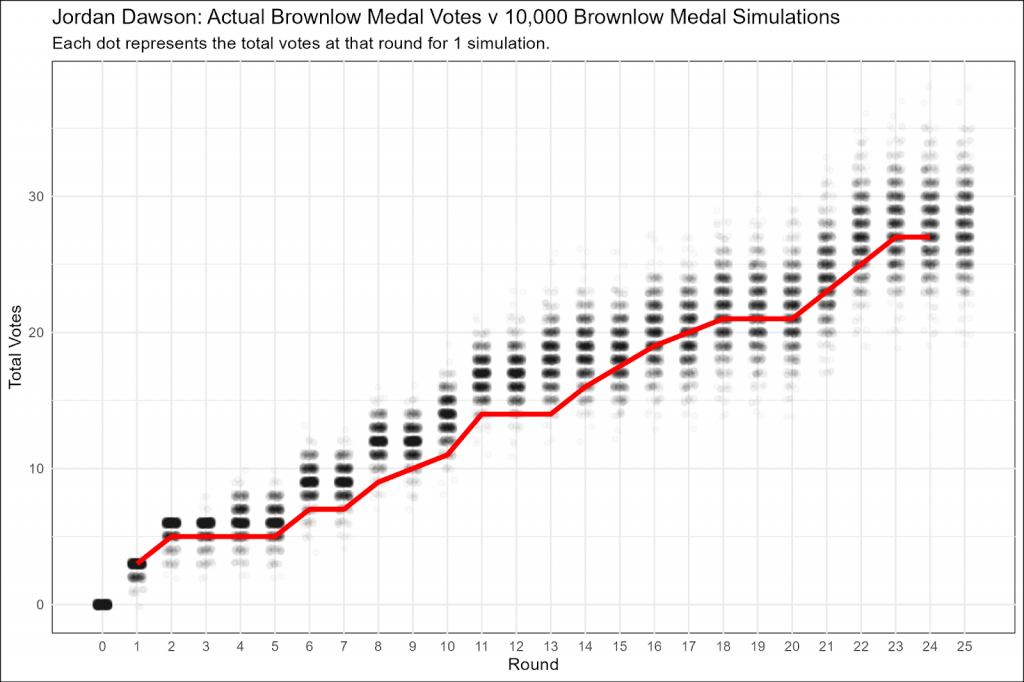
    Two other Brownlow fancies fell within their simulated ranges, Geelong’s Bailey Smith and Adelaide’s Jordan Dawson couldn’t repeat the Rowell effort to overcome Daicos’s implied pre-poll lead.

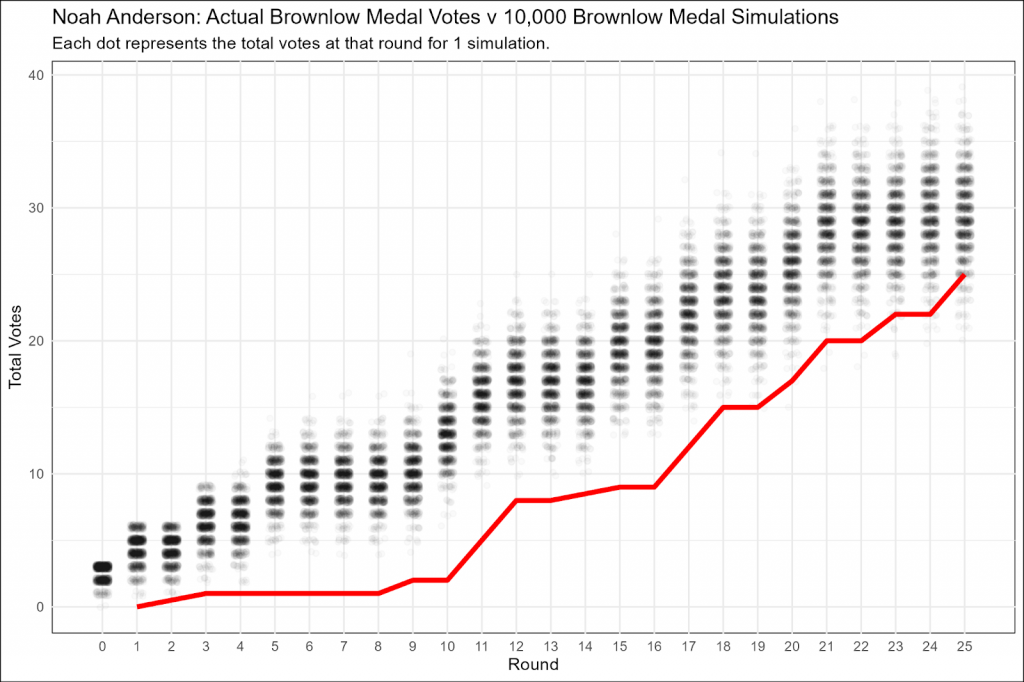
    The big loser of the pre-poll favourites was Rowell’s teammate Noah Anderson with predicted and actual votes of 29.5 and 25. Anderson got a slow start to the count and couldn’t quite make up the difference to crack the top 5.

    Notable mention should go to Fremantle’s Andrew Brayshaw, who polled 26 votes from an expected 20.1.

    So what are the lessons we can take out of the Brownlow, and trying to work out who will win in advance?

    It’s an absolute crapshoot, and in my humble opinion, that’s what makes it great.

    I’ve seen people lamenting online that Rowell is a worthy winner, but simultaneously annoyed that he polled 3 votes in outlier games. The thing is, he doesn’t go on to win the Brownlow unless games like that happen!

    I’d rather the tradition be kept alive with the current voting format, rather than changing it at the whims of a noisy social media contingent. Or, if you’d prefer, you can go to Wheeloratings dot com and sort by average AFL Player Ratings if you want the “True” best and fairest, but where’s the whimsy in that?


    Which umpire put their foot in it when it came to Brownlow voting?

    Lincoln Tracy / lincolntracy.substack.com

    In February this year the AFL attracted scrutiny after giving veteran field umpire Nick Foot permission to appear on a racing program for Sportsbet, the league’s gambling partner.

    Foot was one of the four field umpires who officiated the 20204 decider between Brisbane and Sydney. In addition he has been named as the emergency umpire for this weekend’s clash between Brisbane and Geelong.

    The AFL claimed they were happy with the arrangement as they felt the role had nothing to do with his umpiring duties.

    “He has nothing to do with football, he is not working at or around (football) with Sportsbet. He is doing content on racing, and nothing to do with football. If it (his role) had anything to do with football in any capacity, it wouldn’t have been approved,” a league spokesperson told The Age at the time.

    The matter reared its head again this week during the Brownlow Medal count, where multiple group chats that I belong to wondered whether umpire Foot had anything to do with some of the “interesting” voting decisions announced on the night.

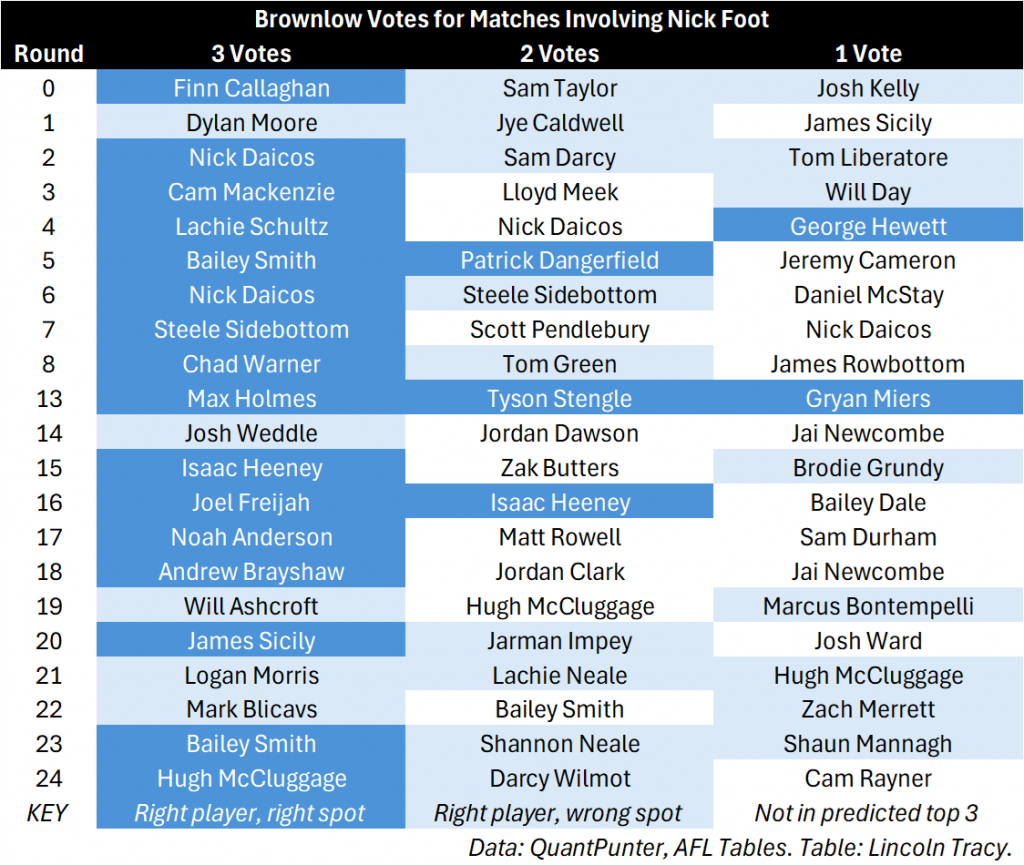
    But an exploratory analysis reveals that the votes awarded in matches officiated by Mr Foot were reasonably well aligned with the consensus of 20 different predictive models collated by X account QuantPunter. Sixteen matches saw the consensus’ #1 ranked player receive the three votes (indicated by the darker blue squares), with the best on ground in the remaining five matches going to a player ranked in the top three.

    And while there was only one match where the votes awarded by the umpires matched the consensus of the predictions, for the most part the umpires in these games were reasonably consistent with the consensus in terms of the top three players – save for a six-week stretch in the middle of the season.

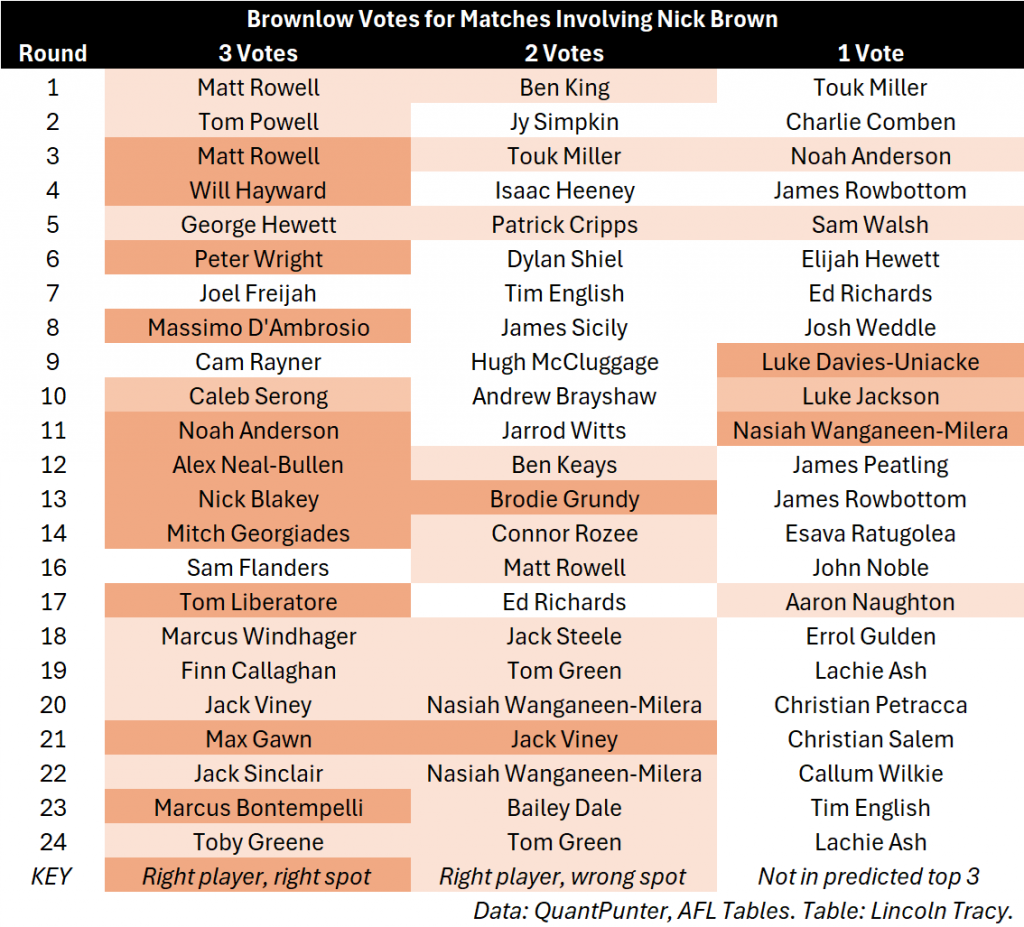
    The performance of Foot and his fellow umpires appears to be more “accurate” than that of other umpires, such as Nick Brown.

    The quartet of umpires involving Brown awarded the three votes to a player who was not ranked in the top three among the QuantPunter consensus data on three separate occasions, and there were many more misses with respect to the player receiving one vote.

    There was even one match where none of the players who received Brownlow votes appeared in the top three among the various models (the Round 7 clash between Greater Western Sydney and the Western Bulldogs). Brown was also part of the umpiring crew that gave the three votes to Jack Viney ahead of Nasiah Wanganeen-Milera when the Saints came from nowhere to beat the Demons at Marvel Stadium in Round 20.

    Select examples such as these make me wonder whether there has been a shift in recent years with how umpires determine which players have the greatest impact on a game – a line of conversation that I know has been happening in some circles – which suggests that even the most sophisticated modelling approaches will need more time and data to account for these changes.

    But on the other hand, it could also be that the models are already highly accurate, and that there are some umpires who are more reliable at awarding votes than others. This inevitably leads to one of the other major conversations that has been happening this week – whether the umpires should have access to statistics when it comes time to hand out the votes.

    Regardless of the underlying cause or reason, and no matter what happens in the future, there will always be arguments about who was robbed of votes and medals for years to come after football’s night of nights. But in this case, it seems that some criticisms might be more warranted than others.

  • Preliminary Finals Week, 2025

    Preliminary Finals Week, 2025

    This Week In Football is a collection of some of the best in football currently outside the walls of AFL clubs or broadcasters. Each week a curated grab bag from regular contributors and special guests will provide insight into and beyond the game on subjects of their choosing. For more about our contributors, click here.

    Banner images by Polly Porridge of the True Bloods Podcast. Check out her other design work.

    Before the Bounce

    And then there were four.

    The 2025 AFL season stands on the cusp of conclusion with Geelong, Hawthorn, Brisbane and Collingwood on the precipice of another flag. In an extremely compelling season four well matched sides are set to excite and engage for just two more weeks before top level men’s football goes away for half a year (the Dub is still there however).

    One might think that this week would filled be wall to wall coverage about the teams left and how they will win the flag. About the aging Collingwood and Geelong, the resurgent Hawks and the reigning premiers. There’s storylines all over the shop, and plenty of intriguing on field wrinkles to break down.

    Unfortunately one would be wrong. Instead the obsession has been on moves for next season and beyond, all delivered from a cloak of official secrecy. Rumours and hearsay are reported with the factual seriousness of match reports. Zach Merrett may not have publicly said anything this week, but everyone else seemingly has.

    There’s room to discuss multiple things at once – people can walk and chew gum. But when the attention of the footy media has so incessantly focused on the mouth closing in and out on that gum, we’ve sort of missed that the legs have carried us to the end of the journey.

    Enjoy the last three games of the year.


    Geelong v Hawthorn

    Geelong

    Jack Turner/The Back Pocket

    Geelong came into the season as one of the stronger fancies for the flag, but a mixed run of form heading into the byes paired with some incredible runs of form from Collingwood and Adelaide, paired with a soft run home for Geelong saw them drop back in a lot of peoples’ estimations – right up until their dominant performance against Brisbane in their qualifying final, where they completely flipped the script on their past two meetings.

    The Cats have proven to be one of the most dangerous sides this year with ball in hand, moving the ball quickly and by foot, using their elite runners and strong contested marks both in front of and behind the ball to cut teams apart on the turnover.

    Geelong are ranked #1 for Marks Inside 50 and #2 for Intercept Marks and Contested Marks respectively, the only team ranked in the top three for all three categories. Once they obtain possession, their run and carry sees them as the hardest team in the game to stop with ball in hand. They are the most effective team in 2025 at scoring from turnover, as well as the most efficient at turning D50 chains into scores, which has resulted in the Cats having more shots on goal than any other side.

    Their ability to create an extra behind the ball – something Brisbane prevented back in round 15 – be it Guthrie, Henry, Stewart or even O’Sullivan makes it extremely hard for teams to score, and the hard running of their half forwards who function as pseudo wings mean they almost always have someone over the top. Most of the time that someone is Shannon Neale or Oliver Dempsey. The numbers show that in order to beat the Cats you have to prevent their uncontested and intercept marking game, as well as scoring quickly from stoppages in the middle of the ground.

    The last time these two sides met was all the way back on Easter Monday where the two sides played another classic, with Hawthorn winning both the marking game and centre stoppage matchups thanks to a career best performance from Lloyd Meek. A brutal concussion to Gryan Miers slowed Geelong’s run somewhat, and Hawthorn did everything they could to peg back the Cats early four-and-a-bit goal lead.

    Where Geelong will likely look to win this game is through their Irish weapons, with Mullin and O’Connor doing vital shutdown jobs all year. It is likely one of the two will head to September Specialist Jai Newcombe, and the other will follow Dylan Moore or Nick Watson. Another crucial match-up is Brad Close heading to James Sicily – Ollie Henry has done this job in the past, but has slipped out of Geelong’s best 22 in favour of Jack Martin. 

    Keep an eye out for the big men in Geelong’s forward half, as first-time All Australian Josh Battle will likely match up on the Coleman Medal winner in Jeremy Cameron, meaning Shannon Neale will look to exploit Tom Barrass’ lack of mobility and get out the back for some crucial goals from turnover.

    Hawthorn

    Sean Lawson

    Hawthorn come into this as at least a modest underdog in the face of a Geelong side who are statistically near the top of the league in most measures for the year.

    Hawthorn’s most notable strengths this year have centred around their potent forward line mix, and some sturdy defenders behind the ball, but their ability to deploy both of those things is downstream of an ability to win enough territory to do so.

    That means gaining ascendency through stoppages to avoid giving away too much terrritory in the first place, and it means somehow beating the Geelong high press when they do end up in defence.

    Around the ball, Hawthorn’s coalface mix minus Will Day are hardly world-beaters but Jai Newcombe has had some eye-catching form so far in finals, bursting out of packs to set them up to score. The Hawks are near the top of the tree for post-clearance ground ball and handball receives, and feeding the likes of Josh Ward and Massimo D’Ambrosio running into space should prove crucial to Hawthorn’s chances.

    Coming out of defence, Hawthorn will surely look to improve on their ability to transition past a high line, having experienced getting trapped in their defensive zone at times through the season, especially in their biggest losses.

    There’s not necessarily an easy answer here – that’s why so many teams have drifted towards the “front half team”meta to begin with. Fully scoring from transition in these situations is one thing, but it’s difficult to do consistently and many opponents are content just to make it a territory battle – kick to a lower risk situation, play for a stoppage, work from there.

    The Hawks have some forward-line marking power to compete with the Cats’ press in the air, and some elite users if they can find the space to make the right kicks through traffic. However in the end, the heat of a final a lot of the Hawthorn defensive escape plan will likely end up built on halving contests on those escape kicks and then either securing the upfield stoppage or, if possible, finding some ground ball speed and handball receives to launch off the pack before everything resets.

    If Hawthorn are to win, the likely word on observers’ lips will be “speed”, both out of contests and coming off the Geelong setup behind the ball.


    Collingwood v Brisbane

    Collingwood

    Cody Atkinson

    In many senses Collingwood and Brisbane are polar opposites. Chaos and control, talls v smalls. It’s what makes the matchup so compelling, and often so close.

    Since Craig McRae has been in charge at the Pies they have often been the gold standard. They’ve manipulated late game situations better than any other side, and finessed space like few other teams before. They flow into space super effectively – it can be quite hard to follow if you don’t know what you are watching for. They often throw their high forwards on the edge of contest and get them flowing into space, and protect behind the ball with a spare. They run in spaced lines, spreading the defence across the ground and creating space.

    If you aren’t prepared, they can really tear you up.

    For Collingwood this year it’s all about defence. Early in the year Collingwood flashed some attacking improvements before injuries and opposition adjustment tempered expectations. Jamie Elliott probably deserved an All Australian nod, but it’s a forward set up that works to maximise its talent instead of having it carried by a small group of stars. 

    Let’s talk about that defence for a second. They’ve been the best at defending across the year in both a per possession chain and inside 50 entry basis. It’s a “bend not break” approach, one that has slightly hurt their transition game as a result. The Pies like to push their running defenders high and hard, banking on a floating spare tall (think Darcy Cameron) can effectively protect space to slow down counter attacks and enable recovery. The return of Jeremy Howe further boosts this unit.

    This defence will be particularly critical considering how ball focused their midfield unit can get at contest at times. Brisbane’s midfield is particularly well balanced between attack and defence, and often leaves little room for easy escapes. If the Pies don’t protect space at stoppage effectively it could lead to a long night for everyone in black and white.

    Brisbane

    Joe Cordy

    Brisbane are the consummate professionals of this finals period. With at least one game to go, they’ve conceded the second fewest free kicks this season (17.7/gm) and controlled possession of the footy as well as any side in the competition.

    Theirs is a game of keeping off and moving by foot. Their elite fitness and running capacity allows them to play the ground like an accordion, spreading wide to pull apart holes in the opponent’s defensive structure before squeezing back in as they lead up to the kicker.

    This makes them unique to other kick-first teams such as Geelong and Adelaide, is their indirectness towards goal. Despite kicking nearly two in every three disposals, they’re well below the league average for metres gained from those. 

    A typical Brisbane chain of possession involves scanning the field, waiting for a teammate to lead into space, that teammate plucking the ball out of the air and repeating, all while using the full width of the ground.

    This patience and execution has significantly lifted the floor on their performances, but combined with factors like figuring out how to play without star key forward Joe Daniher, has significantly lowered their ceiling. They are the only finals side this year to not record a 10-goal victory against any side, and their 54-point win against their local rivals was only the second margin above 45 they’ve recorded this season. 

    This comparative lack of firepower has hung over the Lions all year, and was doubtlessly the key motivator behind pursuing West Coast captain Oscar Allen for 2026 and beyond, but it’s been compensated for by exerting unparalleled control over their games. Part of that foundation has been effectively ruled out for the season however, with captain and hybrid inside ball winner/first receiver at stoppages Lachie Neale battling calf issues. Combined with the absence of their most veteran key forward in Hipwood, and the season may prove to have gone four quarters too long for the Lions on Saturday.

    There’s still a path to back to back premierships and a third grand final in as many years for the Lions, but it will rely on playing outside of their comfort zone and on the dynamism of players like Cam Rayner than the structure they’ve leant on so far.


    Not going down with the ship

    Emlyn Breese / CreditToDuBois.com

    Oscar Allen is set to leave West Coast, Zach Merrett looks increasingly likely to find a new club, and there are now rumours around Jy Simpkin as well. Three current captains all leaving for greener pastures would be significant, but how does it stack up historically?

    All in all, across VFL/AFL and AFLW there have been 50 instances where a player has departed a club as captain for a rival in the same league (including a few instances of mid-year transfers as captain).

    V/AFL captain departures

    The 1982/83 off-season was the most active with four captains jumping ship – Bruce Duperouze from St Kilda to Footscray, David Cloke from Richmond to Collingwood, and Kelvin Templeton and Peter Moore to Melbourne from Footscray and Collingwood respectively.

    Two other occasions have seen three moves. In 2018/19 three captains left from Queensland to Melbourne. Dayne Beams returned from Brisbane to Collingwood, while Gold Coast co-captains Steven May and Tom Lynch both left, for Melbourne and Richmond respectively.

    In 2019/20 the AFLW saw Carlton skipper Brianna Davey join arch-rivals Collingwood, Brisbane captain Leah Kaslar move to new league entrant Gold Coast, with Bulldogs captain Katie Brennan joining Richmond’s inaugural list.

    The 1970s (9 captains moving) and 1980s (8) were the highpoint historically, however if all three touted moves happen this year it will already place the 2020s in the lead with seven moves already.

    AFL and AFLW captain departures and their new homes

    These have been some of the most famous player movements in history. The iconic Roy Cazaly moved from St Kilda to South Melbourne and Ron Barassi’s move to Carlton (and the closely connected sacking of Norm Smith as Melbourne coach) is arguably still the biggest news story in the games history.

    In 1972-73 Geelong captain Doug Wade and John Rantall (South Melbourne) both moved to North Melbourne and were among six players to exercise an early form of free agency under the short-lived “10 year rule”. It was introduced as a precaution against restraint of trade claims, but rescinded prior to the next off-season.

    Under previous transfer regimes, players didn’t even have to wait to the off-season to don a new guernsey. North’s inaugural VFL captain-coach Wels Eicke, Fitzroy’s Jack Casham, Footscray’s Stan Penberthy, Carlton’s Ansell Clarke, and Carlton’s Robert Walls are among captains to have left their clubs for a rival mid-season.

    Captains leaving rarely do so on good terms and contract disputes are a common theme. As Collingwood Vice Captain, Len Thompson would join Captain Des Tuddenham in a player’s strike in 1970. After being stripped of leadership roles, Thompson would eventually become captain in 1978 and hoped to become Collingwood’s first 15-year player since Lou Richards. Instead, he was pushed out by coach Tom Hafey and joined South Melbourne. Two of the next three Collingwood skippers, Peter Moore and Mark Williams would also leave as captain, both acrimoniously.

    North Melbourne’s Dick Taylor resigned during the 1934 season, disgusted with the team’s performance. He offered to stay on as a non-playing coach so long as he didn’t have to wear the jumper again, but North’s policy at the time was exclusively to use captain-coaches and so his resignation was accepted, returning to prior club Melbourne the following year. His replacement, Tom Fitzmaurice, would resign in similar circumstances the following year, having previously quit Essendon in the belief they tanked a game against VFA premiers Footscray in 1924.

    There have been a few instances of players eventually returning to the club they captained, such as John Rantall returning to South Melbourne after winning a premiership with North Melbourne. The oddest of these has to be Tim Watson. Watson announced his retirement following the 1991 season. This didn’t stop West Coast from selecting him in the pre-season draft. The closest to playing a game for the Eagles Watson got was as boundary rider during their grand final win. He would be drafted again by Essendon in the following pre-season draft and lend his experience to the Baby Bombers premiership side.

    The captaincy itself, much like the concept of one-club players, is heavily romanticised and possibly held in higher esteem by fans than those inside a club. While the captain may be an external figurehead, leadership is a joint effort. 

    However, captains have been selected by those within the club (and today generally by playing groups). Having a player in such a position either decide to leave or be forced out can hardly be a good thing. For want of a better word, the vibe stinks, even if it provides interesting list management opportunities (as I think is the case for most of the current touted moves).


    Around the Grounds

  • Finals Week 2, 2025

    Finals Week 2, 2025

    This Week In Football is a collection of some of the best in football currently outside the walls of AFL clubs or broadcasters. Each week a curated grab bag from regular contributors and special guests will provide insight into and beyond the game on subjects of their choosing. For more about our contributors, click here.

    Banner images by Polly Porridge of the True Bloods Podcast. Check out her other design work.

    Before the Bounce

    Eight finalists have become six just like that. Every game now is an elimination battle as the premiership cup draws closer for each club.

    This week James, Cody and Sean will look at what each team will be looking to do – and avoid – in their upcoming Semi Finals.

    Brisbane v GC

    Image – James Ives. Words – Sean Lawson and Cody Atkinson

    Gold Coast Suns preview

    Stepping into the Suns shoes is a bit hard. They’ve already achieved more than they ever have before, and they’ll be going up against a side they’ve already beaten this year.

    The Suns really want to take away Brisbane’s kick-mark game by getting in their face. That means controlling ground ball and stoppage exits. Gold Coast are a dominant ground ball side and beat Brisbane handily when they were able to turn the game chaotic this year, but were beaten by the Lions’ controlled possession game at the Gabba earlier in the year.

    If I’m Hardwick, I’m looking to go head-to-head around the ball. With Lachie Neale out, the Suns will expect to have the edge in gathering and feeding the ball out. The Lions have depth in the middle, but throwing an extra number at the contest could be spreading the Suns too thin in transition down back.

    Even with a dominant midfield we probably can’t score 7 goals from centre bounce again like last time, but that would be the easiest way to win.

    Otherwise, I’m hoping for raw speed, especially by hand, to work out of contests and get deep forward before Brisbane can fully get back. If the game turns into kick-to-kick, the Suns will be in trouble.

    The Suns will hopefully feed it deep to Ben King on his island effectively, getting a few clean marks and otherwise letting Long, Humphries and co go to work in the space he creates.

    Brisbane preview

    If stepping into the Suns shoes is hard, the Lions are in an even tougher spot. The reigning premier from last year is missing their captain and one of their forward focal points. At some level the personnel is what it is – at this time of year it has to be next player up to get the job done.

    The most important thing for the Lions is to effectively control how the Suns use the ball at clearance. If having Neale missing means that we will lose a few more hard balls, we need to be ready defensively to protect the exits. I might want to throw an extra number around the contest and following the ball to clog up the contest – sacrificing a high forward to protect space a little better.

    The next most important thing is to get the game on our terms. That means taking the pace out of play, and preventing the surges through the ground from the Suns. Moving the ball carefully by foot will be critical, as will be establishing the contested marking game. Playing Fort and OMac together is a risk from a speed perspective, but it might just stretch the defence and open easier avenues to goal.

    Working out how to replace Hipwood is at the front of mind as well. The Suns defence is solid, and are willing to back themselves in without a bunch of extra numbers down back. Making space with smalls deep is key, but also making targets up the ground will be critical.

    Creating mismatches for Logan Morris and Charlie Cameron might be key as well – the Lions might try to force some switches and to deploy their unit in different ways to before.

    Adelaide v Hawthorn

    Image – James Ives. Words – Sean Lawson and Cody Atkinson

    Adelaide preview

    Last week wasn’t great, but it wasn’t terrible either. If I am the Crows it’s about staying the course about what worked this year.

    That means I’m looking first to defence in all parts of the ground as the primary route to victory. A 10 goal to 8 grind sounds like a fine way to win a final and I’m setting up for a lot of stoppage contests. I’m also trying to find spares in defence and protect as much as I can from damaging attacks.

    The Hawks get a lot of good ball up forward when given the chance – second in marks per inside 50 – and we really need to limit that given our own difficulties scoring. That means blanketing them in all phases of play, which luckily we’ve done well all season.

    The Hawks are a middling deep transition team so in going forward, I’m confident in our strong defence of against transition against me. Two middling transition teams means contest and territory is going to matter a lot and we can lean on our usual kick-first possession profile. I’m probably content leaning on a lot of quick long kicking, with any sort of dirty ball enough to set up to go again.

    The Hawks are going to want to move the ball by hand so we need to prevent forward handballs from contest and flowing through the middle of the ground. Jumping lanes is critical, as is holding space and not overcommitting to the player with the ball. If needed, make them use the ball one too many times rather than one too few.

    With this contest focus, the quality of the entry inside 50 will likely suffer. The hope is that the weight of numbers will brute force enough decent kicks inside 50 to get to get the chances to score needed.

    Hawthorn’s height in defence makes me think there’s a chance to beat them for pace at ground level with my non-key forwards, though it does make me think Thilthorpe and Walker have their work cut out halving contests.

    If the Crows lose the territory battle it could be game over – so getting first possessions at stoppage will be critical.

    Hawthorn preview

    Last week looked great until it didn’t. If I’m the Hawks I’d be starting to get a bit worried about how streaky the play has been against good sides. Resilience is one thing, but consistency is key.

    The message for the Hawks would be simple – split the territory battle and trust the forwards to execute. That’s why Lewis has come in – to space the forward line further. Finding chests inside 50 is the pathway to victory. Giving Gunston the room to operate will be crucial – if we can get the Crows to over-adjust the game could be over.

    The Crows love to kick the ball, so making sure they can’t find targets is critical. They’ve also got a lot of mobile talls that can move up the ground. Making sure that we are protected deep at all times with a deep spare will be critical to stopping forward thrusts.

    They might try to suck us into a number of repeat stoppages, so making sure we can execute blocks for Newcombe and co will be critical. Getting the stoppage set up right will be key.

    The Hawks also need to effectively get the ball to at least halfway when rebounding from 50. The Crows kill teams by trapping them up the ground. Everything beyond halfway is a win – because that means their defence will be at breaking point.

    Sitting wide might be key to exploiting their high press. Making sure the fat side wing stays wide could make the ground big, and make it easier to counter attack. Rewarding leads will also be critical to making this space.

    Age and Experience in AFLW 2025

    Emlyn Breese / CreditToDuBois.com

    There’s been some commentary in the public about AFLW squad ages this season. Usually, the rule of thumb is that older teams tend to do better than younger sides, but is that stacking up so far this year?

    There’s some difference between the age of a squad and the age of sides selected week-to-week can vary a lot so I wanted to have a dive into that.

    Three of the four undefeated teams are amongst the youngest sides selected so far this year (Hawthorn – youngest, Sydney – 4th youngest, Melbourne – 5th youngest). Sitting just behind the undefeated sides is the 3-1 West Coast. They happen to be the 2nd youngest selected side this year.

    The undefeated Roos are unsurprising as the oldest team so far this year, but the winless Richmond being the second oldest is potentially cause for concern.

    The ideal for a future outlook is to be both young and have game experience. The only teams that are both below the median age and above the median experience this season are Melbourne and the Dogs. 

    On the chart above the teams above the diagonal line have more games of experience than you’d expect for a team at that age profile (based on league average).

    For a bit more context, how does this stack up against previous seasons?

    Note: Some pre-2024 data may not be 100% correct, but it should be directionally correct due to the use of median instead of mean.

    As we’d expect, the experience of selected sides has gone up as the competition has advanced. But, we can see the same isn’t the case for age.

    Another note: We’re looking at sides selected from rounds 1-4 compared to sides selected over a full season. Take the same side in Round 1 and play them through the season and the median age will have increased by three months and the median experience by 10+ games.

    At the start of the competition the best players were typically either those with extensive footy experience through amateurs, or those with professional experience at the elite level of other sports. We’re now getting players come through who have had elite pathways through footy. I think that’s probably driving the median age staying low – we’re getting draftees who are pushing from selection from the moment they walk in the door.

    The same data source I draw on for ages also has heights, so I thought it would be fun to take a look at the tallest teams selected.

    Of the 11 tallest teams across a season, 4 of them are from this year, and Gold Coast from Season 7-10 also occupy 4 of those 11 slots including a monopoly on the top 3.

    At the other end of things the shortest teams this year are St Kilda, Richmond, and Brisbane, each clocking in at 169 cm, putting them equal 21st shortest (alongside a further 17 teams from previous seasons).

  • Pre-finals Bye and AFLW Round 3 2025

    Pre-finals Bye and AFLW Round 3 2025

    This Week In Football is a collection of some of the best in football currently outside the walls of AFL clubs or broadcasters. Each week a curated grab bag from regular contributors and special guests will provide insight into and beyond the game on subjects of their choosing. For more about our contributors, click here.

    Banner images by Polly Porridge of the True Bloods Podcast. Check out her other design work.

    Before the Bounce

    Finally, a break.

    For the last 24 weeks there has been end to end men’s football. This is the last pause in that competition before the race for finals heats up.

    This is the last moment of calm before the storm, before the stakes get raised.

    Meanwhile, the AFLW season hits starts to hit full stride with clear air for the league to bathe in. The footy is good – probably better than it ever has been before. If you’ve got a hankering for footy, get to a game this weekend (or flick on the TV).

    This week in football we have:


    The TWIF MVP

    Adrian Polykandrites | fromthetopdeck.com | @fromthe_topdeck 

    The home-and-away season is done and dusted, which means it’s both finals time, and awards season. 

    On Thursday night, Nick Daicos was named MVP by his peers, while Noah Anderson and Bailey Smith were joint winners of the coaches award. In a few weeks the league will crown another Brownlow medallist (or multiple). There’s also a bunch of awards handed out by some of the major media companies that cover the game.

    And while they all carry a certain level of prestige, they’re also a bit eye of the beholder in terms of how much they mean.

    While it’s ingrained in footy to use weekly votes to decide most of those awards, there’s the inherent problem that not all best-on-ground performances are created equal, but the votes don’t know that and can’t distinguish.

    When done well, the best awards serve as something of a time capsule. They (should) tell us who mattered most in any given season.

    The This Week In Football gang has had a crack at determining who that should be for 2025. 

    Following NBA MVP voting rules, each voter named their five best players for the season. The top player received 10 points, seven points for second, five for third, three for fourth and one for fifth.

    Without further ado …

    13th – 1 vote: Matt Rowell, Sam Taylor and Max Gawn

    Three very different players each received one fifth-placed vote. 

    Emlyn Breese said of Gawn: “There are few players I’ve ever seen who have the capacity to shape a game and do so regularly as Gawn still does.”

    While James Ives thought the GWS key back was worthy: “By far the best interceptor in the competition. And while GWS get a high volume of numbers back to support, I’m not sure they can get away with their style of play without Taylor.”

    12th – 2 votes: Caleb Serong

    “It’s almost a 15-way toss up at this point. You can make a good argument for Pickett, Taylor, Green and less convincing but still solid for another dozen. Serong has been impressive, shook tags and stood up when it’s mattered most for a success-struck side.” – Cody Atkinson

    11th – 3 votes: Luke Jackson

    Ryan Buckland had the Fremantle big man fourth on his ballot: “Can’t help but think without his versatility and skill the Dockers would not be in the position they are in. Underrated aspect to his game: he allows Fremantle to play Sean Darcy as a pure ruck which allows ~him~ to be the best he can be.”

    10th – 5 votes: Kysaiah Pickett

    Joe Cordy gave the Demon his third-place vote for a “Career season as the best mid-forward in the game, keeping his level while the team falls apart around him.”

    Ninth – 6 votes: Bailey Smith

    The new Cat and now coaches award winner received fourth-place votes from two contributors.

    The Back Pocket’s Jack Turner was one of them: “Has genuinely transformed Geelong’s midfield and run.”

    Seventh – 7 votes: Sam Darcy and Nasiah Wanganeen-Milera

    Two players from the 2021 draft who had breakout seasons, with Wanganeen-Milera earning his first All Australian blazer on Thursday night.

    The Saint featured on three ballots with Emlyn Breese voting him third – “I think he’s the model of what you want in a footballer right now.” – and two other voters placing him fifth. 

    James had Darcy second on his ballot: “His contested marking is unparalleled. You only have to look at Naughton’s numbers with and without Darcy to see his impact. Nullifying Darcy goes a long way to nullifying the Dogs.”

    Sixth – 15 votes: Harris Andrews

    James thought the Brisbane key defender worthy of maximum votes: “He’s the best two-way key defender in the competition and his ball use is severely underrated and critical to what Brisbane do.”

    Fifth – 20 votes: Nick Daicos

    I had Daicos fourth on my ballot – he’s the beating heart of a top-four side – while two others had him third. Ryan, however, had him as the season’s second most valuable player: “ Even in probably his most disappointing year to date … Daicos still managed to be the electrical rhythm that reanimated an otherwise corpse-like Collingwood side.”

    Fourth – 29 votes: Noah Anderson

    I was one of three voters to have the Suns’ skipper third on my ballot. He’s one of the most complete players in footy. 

    “It still feels like he doesn’t get talked about enough for how good he is,” said Emlyn, who had Anderson second. 

    Third – 30 votes: Jeremy Cameron

    I had the Geelong superstar second. The Cats are stacked, but Cameron raises their ceiling more than any other player on their list. He’s the biggest reason they’re the team to beat over the next month.

    Cody had Cameron first – “The most important player in probably the most complete team. Was asked to do far more than his position suggests. Didn’t miss a game which also helps.” – as did Joe.

    Second – 49 votes: Jordan Dawson

    I was one of two voters to have Dawson at the top of my ballot. The Adelaide skipper made a habit of stepping up in big moments in leading the Crows to the minor premiership. There might be only one onballer more well-rounded. 

    Mateo Szlapek-Sewillo had Dawson second, but had similar praise: “He’s the captain (and best player) for the side that just completed the largest single-season rise up the ladder in AFL history. Consistently produces his best football in the most important moments.”

    First – 58 votes: Marcus Bontempelli

    The Dogs’ skipper will be watching the finals, but that didn’t stop four voters putting him at the top of their ballot. I had Bontempelli fifth, while only one voter left him off entirely.

    Voters were similarly aligned as to why the seven-time All Australian should get top votes, but Ryan perhaps summed it up best: “This guy is still so obviously the only answer to the question of, ‘If you could pick any player in the league for your team, who would you pick?’ There’s a gulf between him and the rest.”


    Who was the biggest All Australian snub?

    Jack Turner | The Back Pocket | TheBackPocketAU

    While we are only at the squad stage at the moment, there are already some players who fans are shocked to see have been left out. But who were the biggest snubs from this squad of 44 – 22 of whom are set to receive new or updated blazers tonight.

    Of the 44 player squad, 28 have never made an All Australian team, meaning at least 10 players will receive an All Australian blazer for the first time. Some of the more surprising players to miss out are also yet to receive an All Australian selection.

    While there are cases to be made for nearly a dozen players to be very unlucky, we’ve narrowed it down to three big misses. For any stats referenced below, they will include only players who have played 16 or more games, as this seems to be the unofficial cutoff point for All Australian selection guidelines.

    Callum Wilkie – St Kilda

    Callum Wilkie received his first and only All Australian blazer in 2023, and was arguably unlucky to miss out on both squad and team last year. In both 2023 and 2024, Wilkie was supported down back by Josh Battle, who left as a free agent to play at Hawthorn this season, and was instead supported by the much less seasoned – though still serviceable – Anthony Caminiti.

    Amongst eligible key defenders, Callum Wilkie has the third highest Player Rating, the second most Coaches Votes, and of players averaging 2+ Contested Defensive 1v1s he has the 7th best record. He is behind only Harris Andrews for kicking retention rating amongst key defenders, and inside the top 10 for threat rating amongst the same group. He has also taken more marks than any player in the competition in 2025.

    There are only two players averaging 15 disposals, have a less than 25% CDOOO loss rate (2+ avg) and have received 30+ coaches votes in 2025. One is Callum Wilkie. The other is his former teammate and 2025 AA squad member Josh Battle.

    Oliver Dempsey – Geelong

    This one is a little more complicated than the other two I’m going to write about here, because there is a fair argument to be made that Dempsey clearly has not been in the best 40 players in the AFL this season. But I think it’s also fair to say that players like Lachie Ash, Sam Collins and Josh Worrell wouldn’t fit that criteria either, and have been selected based on their position.

    And this is where we face the All Australian team’s biggest issue in recent years head on; the All Australian team simply refuses to pick genuine wings in the team, and this year that seems to be true for the squad. Not a single midfielder in the team has a Centre Bounce Attendance percentage of less than 50% – with the exception of Wanganeen-Milera, who was used as a half-back for much of the year. The main candidates are outside midfielders such as Bailey Smith, Finn Callaghan or Nick Daicos, but none of these players are wings; they are centre bounce specialists. Rovers and receivers.

    Of players listed as a midfielder who have attended less than 25% off their team’s CBA’s, Ollie Dempsey has the second highest Player Rating, the most goals, the third highest contested possessions, the most score involvements, the third highest goal assists and has the fourth highest threat rating per kick.

    Football is a much more complicated game than it once was, but with the introduction of the 6-6-6 rule, and available starting position and matchup data; it should be easy enough for selectors to add players to the squad from a list of genuine wingers.

    Aaron Naughton – Western Bulldogs

    I have saved perhaps the most egregious snub – and maybe the one I am most baffled by – until last. Many are quick to point out that Aaron Naughton started the season off slowly from a goals perspective, but he was still averaging 6.5 score involvements across his first ten games – a figure that would see him in the top 10 key forwards had it continued for the whole season.

    Another critique is that his form improved once Sam Darcy came back from injury, but I think it’s fair to say that most key forwards clearly struggle without a genuine foil, including the others who have been nominated this year.

    Over the season, Aaron Naughton amassed an impressive 60 goals – especially impressive as he had Sam Darcy in there with him kick 48 in the same year – finishing fourth in the Coleman medal, just two goals behind third. He finished behind only Jeremy Cameron and Mitch Georgiades for marks inside 50 and behind only Jeremy Cameron for score involvements by a key forward – finishing 8th overall in this stat.

    Furthermore, of the players who kicked more than 50 goals this season, he led the way for the most score involvements that weren’t from a shot on goal that he took, bringing his teammates into the game just as often as scoring himself.

    The full list of players with 50 goals and 150 score involvements in 2025 is as follows: Jeremy Cameron, Aaron Naughton, Riley Thilthorpe, Jack Gunston.


    The AFLW meta shaping up

    Emlyn Breese / CreditToDuBois.com

    Note: this article is published during AFLW indigenous round. I have used the names six teams have adopted for the duration of the round. You can read more about indigenous round and those teams here: https://www.afl.com.au/aflw/indigenous/clubs

    As a Narrm (Melbourne) supporter it should surprise no-one that I have been absolutely hanging out for the Women’s season. It’s still obviously really early, so the focus will mostly be on the teams that appear to be separating from the pack two rounds in.

    As per last week, I’m still building a lot of this data gathering infrastructure as I go, so I’ll have more time to dive into what it tells us as that settles in later in the season.

    First I wanted to build upon my very brief look at scoring shots in AFLW last week.

    Sydney and Melbourne have very similar profiles for where their scores are being generated and conceded – big positive turnover differentials, and a healthy stoppage differential.

    Essendon share a similar, but lesser, turnover differential but they’ve actually got a negative differential on stoppage scoring shots.

    Where it gets really interesting though is the Kangaroos. Of their 33 scores they’ve generated 28 of them from turnover, 2 from centre bounces, and just 3 from other stoppages. More broadly, they’re actually in the negative for clearance differential (-0.5 per game). This is a stark difference to the other undefeated sides who make up the 4 best clearance differentials range from +10 (Hawthorn) to +4.5 (Sydney).

    Where the Roos are leading the competition is generating turnovers (1st at +9/game) and uncontested possessions.

    The Kangaroos have had 55.5 more uncontested possessions per game than their opponents, with Sydney and Narrm inches behind at +55. The next best is Brisbane a massive step back with 19.5. To me there’s a clear meta forming around uncontested possession, and I think success will be driven by harnessing or countering it.

    For Narrm this is something of a return to past success. In their flag-winning season 7 campaign they recorded twice the uncontested possession differential of the next best team.

    Even among the three leaders there are significant differences though. Sydney and North are finding a lot more uncontested marks, each about 20% above the league average. They’re also two of the top three teams for retaining uncontested possession from a kick (the third being Kuwarna (Adelaide)). Narrm by comparison find themselves in the bottom 6 for kick retention.

    Accordingly, Narrm are below league average in uncontested marks, despite leading the league in possession differential. Where Narrm do stand out is their handball use and pressure. 46% of the Demon’s disposals are by hand, compared to a league average of 39%. Sydney are at league average while the Roos are slightly below.  Their handball receives are 15% above the next best (Sydney) and 50% above the league average.

    Narrm are also leading the league for opposition disposals per tackle. With the stricter interpretation on holding the ball, a combination of quick hands to release and tackling pressure on the opposition bodes well for them.

    One other thing I found in my travels leads me to giving a shout out to Georgie Cleaver. Waalitj Marawar (West Coast) have some real problems structurally, conceding a mark inside 50 from 36% of their opponent’s entries. But, they’ve had 17 defensive one-on-ones and are yet to lose one. This is led by Cleaver who is 0 from 7. If they can sort out some of the structures they’ve potentially got an elite pillar to build around and she’s only 20.


    Estimating score assists

    Andrew Whelan / WheeloRatings.com

    Following on from last week’s article on score involvements and score launches, this article will explore score assists.

    While there’s no publicly available data on score assists, I wanted to investigate if they could be estimated using available data on goal assists. As score assists include goal assists, we only need to estimate behind assists.

    Firstly, here is the definition from the Champion Data glossary:

    • Score assist: Creating a score by getting the ball to a teammate either via a disposal, knock-on, ground kick or hitout, or by winning a free kick before the advantage is paid to the goal scorer.

    The definition makes no mention of disposal effectiveness or the intent of the player getting the ball to their teammate. Champion Data provides an example on their FAQs page which tells us that if the player’s intent was a shot at goal but the kick fell short and went to a teammate who scored, this would be treated as an ineffective kick and would not be counted as a score assist.

    As such, the definition only tells us that a score assist is limited to disposals, knock-ons, hitouts, and free kicks, but doesn’t provide enough detail about the specific circumstances that result in an assist being credited.

    What does the data on goal assists tell us?

    Using data on goal assists since the start of 2021, we can determine how often a goal assist is credited based on how the goalscorer gained possession and the effectiveness of the prior disposal.

    If we were to credit an assist for all goals above the line and none below, we would be correct for ~94% of goals. This gives us a reasonably reliable methodology for estimating behind assists, which we can combine with actual goal assists to estimate total score assists.

    Score assist analysis

    Hugh McCluggage leads the competition with 54 score assists this season, with a clear lead over Brad Close, Ed Richards and Marcus Bontempelli. Richards leads the goal assists with his teammates kicking 35 goals and only eight behinds from his assists. In contrast, McCluggage’s teammates have kicked 22 goals and 32 behinds from his assists, with all three of his score assists on Sunday being behinds.

    McCluggage is approaching Gryan Miers’ 61 score assists in 2023 with at least two finals to come. This was mentioned on the ESPN Footy Podcast a few weeks ago, and Champion Data’s count of score assists for McCluggage this season and Miers in 2023 were consistent with these estimated counts.

    Here are all players with 30+ score assists in a season since 2021.

    Jeremy Cameron and Brad Close have combined for the most scores (52) over the last five seasons, with Close assisting Cameron for 40 scores and Cameron reciprocating 13 times. Aaron Naughton (39) and Marcus Bontempelli (12) have combined for 51 scores.

    Aaron Naughton (12) and Ed Richards (2) have combined for the most scores this season, closely followed by Jeremy Cameron (12) and Brad Close (1), and Jeremy Cameron (11) and Shaun Mannagh (2).


    More on the best and worst sport cities

    This week for the ABC Cody and I ran a piece looking over the terrible sporting history of the booming city of Gold Coast. As a spoiler, the Suns did indeed break their finals drought with a win over Essendon, which means they slightly improved the city’s nation-worst record of elite men’s football teams making finals in just 13% of the seasons they compete in (it’s now 15%).

    Using all the data compiled for that article – namely finals rates reached by teams based on each city since 1987 – here’s a look comparing cities more broadly.

    First up the Central Coast turns out to be the most successful sporting city in pure percentage terms. That’s thanks to the very successful Mariners winning three championships and making finals most of the time,

    The Mariners are just one regional success story in Australia, with most regional cities other than Gold Coast have at least one club making fans happy. These include the Cats in Geelong, the Sunshine Coast Lightning, the JackJumpers in Hobart, the Illawarra Hawks in Wollongong, and WNBL teams the Fire and Spirit in Townsville and Bendigo respectively.

    Among the “big 5” cities, it’s Adelaide just barely ahead of Brisbane as the top sporting city.

    Here’s a breakdown of the win rates for teams in each city with at least ten seasons under their belt, showing how Adelaide’s all-round selection of decent teams makes them a solid showing in nearly any sport.

    Some of the most successful teams in the country of course lead their cities’ records, including the Sydney FC women’s team, the Melbourne Storm, and of course the frankly astonishing success (missing finals once in 4 decades) of the Wildcats.

    When it comes to the title of best major sporting city, though, individual dominant teams like the Wildcats just don’t quite compensate for struggles in other sports out west, like soccer, rugby, and Dockering.

    Adelaide performs well comparatively in women’s sport, too, which leads us to another breakdown of these records:

    Looking at cities by gender, we can see that mostly due to the Titans women, Gold Coast is faring notably better in women’s sport than in men’s. It may be too soon to say for sure, but there’s incipient signs that the Gold Coast sporting curse may be a single gender affair.

    The city of Geelong have had the best record of success in men’s sport, much more because of the regular Cats of the AFL than the Supercats of the NBL.

    Among the big 5 cities, Perth is lagging in women’s sport performance, perhaps a result of the tyranny of distance impacting harder in the generally less well funded and resourced world of women’s sport.

    Perhaps surprisingly, Canberra is the city with the largest negative gap between women’s and men’s clubs performance, with Canberra indeed having the second lowest women’s sport success rate after Newcastle.

    On the surface this is surprising, given that Canberra is a progressive city with a strong record of supporting women’s sport. Indeed, Canberra is the only multi-team city which has hosted more seasons of elite women’s sport than men’s.

    Many of those numerous women’s seasons are of course the reason for the gap, however. Teams like the Capitals (9 titles) and Canberra United (2 titles) have great legacies of success as standalone teams in cities without men’s counterparts in their sport. However, both have also spent extended periods missing finals in between golden periods.

    Canberra also, for several decades, hosted a mostly forgotten second WNBL team, the Australian Institute of Sport, which was a development side made up of youngsters and basically only made finals when Lauren Jackson was leading them to a title.

    Around the Grounds

    • Marnie Vinall reports for ABC on what Mitch Brown’s announcement means to queer fans.
    • It is very funny that the AFL Coaches Association awarded a “best young player” award to a 28-year old.
    • On Sarah Burt and Georgie Parker’s podcast AFLW Weekly, Georgie worries for the way AFLW salaries, newly outpacing Super Netball pay, are beginning to lure star players across and hurt a well established traditional sport.

  • Round 24, 2025

    Round 24, 2025

    This Week In Football is a collection of some of the best in football currently outside the walls of AFL clubs or broadcasters. Each week a curated grab bag from regular contributors and special guests will provide insight into and beyond the game on subjects of their choosing. For more about our contributors, click here.

    Banner images by Polly Porridge of the True Bloods Podcast. Check out her other design work.

    Before the Bounce

    This upcoming round is about to see the maximum amount of elite footy played in one week in the modern football era.

    Nineteen games of elite football will take place in a seven day period out to Wednesday’s makeup game between the Suns and Essendon. With the compressed 2020 Covid season not reaching such levels, the last time top level footy saw so much action was probably in the state league era when three states saw top level footy at once.

    It all gets a bit difficult to keep track of, particularly as the AFLM and AFLW continue to exist, despite some level of web and app integration, in somewhat parallel media and fixturing spaces. Look up what games are on when, and chances are you’ll only see half of them listed.

    Luckily, friend of TWIF Polly Porridge has done something the AFL should have already done via its official app. Polly has put together a match listing for all of the weekend’s games with all AFLW and AFLM starting times with all games listed chronologically (all times AEST):

    It’s a whole lot of footy – fifteen games in two days – for everyone.

    Hope you are ready for Peak Football.

    This Week in Football we have:

    Breaking down score involvements and score launches

    Andrew Whelan / WheeloRatings.com

    For my first TWIF article I will explore score involvements and score launches. What are they and who are the leaders this season?

    Here are the definitions from the Champion Data glossary:

    • Score involvement: Number of scoring chains where a player was involved with either a disposal, hitout-to-advantage, kick-in or knock-on. If a player has two disposals in the same scoring chain, he is credited with one score involvement.
    • Score launch: Scoring chains launched by an intercept possession, free kick, hitout-to-advantage or clearance.
    • Scoring chain: Includes all disposals and possessions for the scoring side that occur between the score launch and the actual score. The chain can only be broken by either the opposition gaining possession of the ball or a stoppage.

    Working back from the score itself, the scoring chain begins at the most recent stoppage, kick-in or when the scoring team last gained possession from the opposition. Only a stoppage or a change in possession breaks the chain – a spoil from the opposition does not break the chain, nor does an ineffective disposal from the scoring team if possession is retained.

    For scoring chains that start with a kick-in or an intercept possession, the score launch will be credited to the player taking the kick-in or winning the intercept possession (which may be a free kick). For scoring chains starting with a stoppage, if there’s a hitout to advantage AND no opposition player took possession of the ball pre-clearance, the hitout to advantage will be the score launch, otherwise it will be the player winning possession pre-clearance and starting a chain of unbroken possession.

    Scores, score assists and (most) score launches are included in the count of score involvements.

    Interesting side note – if a scoring chain starts with a free kick and a teammate takes the advantage, the player winning the free kick gets a score launch but does not get credited a score involvement unless they have another involvement later in the chain.

    One correction I would make to the score involvement definition is changing the second sentence to “if a player has multiple involvements in the same scoring chain, he is credited with one score involvement.” A player with a hitout-to-advantage and a disposal in the same chain is only credited with one score involvement.

    To provide a visual example of scoring chains, the following chart shows all Adelaide’s score involvements against Collingwood in Round 23. Each point represents a disposal, hitout-to-advantage, kick-in, knock-on or spoil, in chains resulting in a score. The tooltip for each data point provides additional detail of their specific involvement.

    Here is a summary of all non-score score involvements by type of involvement since the start of 2021.

    And here are the types of involvements launching scoring chains.

    Who’s leading the score involvements this season?

    Ed Richards and Nick Daicos are first and second in total score involvements this season with a similar breakdown of score launches, score assists, scores, and other score involvements. Next is Jeremy Cameron with two thirds of his score involvements being his own score. Rounding out the top five is Hugh McCluggage, who leads the league in score assists, and Christian Petracca, who’s number one in the AFL for average score involvements since 2021.

    Score assists have been estimated and will be the subject of a future article.

    What about score launches?

    Max Gawn is leading the way in score launches averaging a career high 4.27 per game – the second highest season average since 2012, behind Todd Goldstein in 2015. Witts and Xerri aren’t far behind, averaging 4.15 and 4.05 per game, respectively. Max has launched 17 scores from intercept possessions this season, 32 from hitouts to advantage, and 45 from winning possession pre-clearance.

    Here are the leaders this season.


    Diving into the first week of 2025 AFLW

    Emlyn Breese / CreditToDuBois.com

    With the first week of AFLW in the books it’s worth spending some time looking at what we can get out of the early data available.

    I’ve started off by trying to identify score sources. This is relatively easy to get for the Men’s competition, but faces some extra challenges in the Women’s. This is still a work in progress, so take with a grain of salt. Because the sources are new, there’s no prior year comparison available.

    Overall we can see scores from kick-in even more negligible in AFLW than AFLM, and we also see a bigger prevalence of scores from turnover.

    Let’s now look at it on a game-by-game basis:

    Port are the only team to have scored a goal from kick in, with Katelyn Pope’s last quarter goal.

    Essendon and Melbourne had the most scoring events from turnover, while the Sydney v Richmond match saw both teams scoring as many times from stoppage as from turnover.


    Winning the ball by degrees

    Cody Atkinson

    All teams want to do two things as much as humanly possible. 

    1. Win the ball
    2. Score

    If you’ve got the ball you can score, and the other team can’t. And – spoiler alert – if you score more than the opposition you win.

    Someone get me on the line to eighteen different clubs, this is groundbreaking stuff.

    But not all won ball is the same. Some is won hard, and some is loose. Some leads to territory gains, others are turned over right away. Importantly – and linking to point 2 above – some ground ball wins lead to actual scores.

    This year Tom Green has won more ball on the ground than any other player. He’s averaging 10.1 ground ball gets per game. If you break it down further, 3.4 of those are classified as “hard ball gets” and the remaining 6.7 as loose ball gets.

    This is where on the ground he has won them this year.

    Green follows the ball – and the contest – around the ground. While there’s an expected cluster in the middle, there’s also a fair bit of action on all four corners of the deck. Note – the ground shape is normalised for the dimensions of the MCG – hence some of the boundary issues.

    If you break it down by scores generated by ground ball wins, something interesting emerges.

    That big cluster in the middle all but disappears. The Giants have struggled to turn Green’s inside ball into points from the middle, despite everything they’ve tried. The Giants are firmly mid-pack for points from stoppages and points differential from that source. That means a lot of Green’s work either hasn’t gotten teammates into space, or the chain of control has broken down towards goal. It’s been a longstanding issue for Adam Kingsley, and one that he needs to resolve to get the most out of the best ballwinner in the league.

    As mentioned above, there are two broad types of ball to be won. The first requires physical pressure and contact. This year, no player has won more hard ball than Tom Liberatore.

    Like Green, Libba follows the ball around the ground when it comes to rest. The second generation Dog has an even more pronounced cluster in the middle, but has a heavy lean to the defensive side of the centre square. That hints to his positioning at centre bounce – at the defensive sweeper side. That job is difficult, and requires balancing winning ball and preventing opposition sides from sweeping through the contest. Few can manage that balance well – let alone winning so much ball themselves.

    Most ground balls are classified as loose balls however. They happen at stoppages, but also often occur in general circumstances around the ground. This year two-time Brownlow Medalist Lachie Neale is leading the way.

    Neale’s loose ball wins are less focused on the middle. It’s a testament to his endurance ability and skill in reading where the play is likely to unfold. Neale has a nose for the ball, and to predicting where it will go before it gets there.

    No matter if it’s hard or loose, straight from a ruck tap or occuring in the middle of a transition chain, every team needs good ball winners. Green, Liberatore and Neale have been the best three this year. All three are reasons that their sides are firmly in the race for September glory.


    How does Nasiah Wanganeen-Milera’s reported contract value stack up?

    Sean Lawson

    With reports saying Nasiah Wanganeen-Milera has just become the first player to earn $2 million in a single season, it’s a great time to try to put that into context and see how it compares to the big contracts of years gone by.

    AFL contract reporting is a very nebulous activity. Reporting around individual player contracts is often vague, misleading, and subject to spin by reporting parties.

    We do know a few things for sure – the salary cap value, the minimum pay for draftees, the rough spread of player contracts.

    We know as of last year the typical club senior list would have been structured roughly as below, with an average of two players on over $1 million a year. This figure is very likely to rise to at least three per team on average in 2026.

    We know that, on average, the top three players might earn about 20% of the salary cap, and the top 6 players around one third of the salary cap.

    We also know that cap keeps going up:

    The salary cap is roughly double what it was in 2012, triple what it was in 2004, and just much larger than the 1990s. The cap growth has outpaced inflation and, in the case of some long deals, even left players behind as the cap grew around them. The AFL-AFLPA CBA has a ratchet clause for insertion in standard player contracts, but league sources indicate that insertion is not universal across the board.

    That leaves the unknowns. Even when news reports appear to carry fairly specific contract values for a player, often this number will be under or over what they actually earn:

    • Agents have incentive to inflate contract values to bolster their percieved effectiveness.
    • Clubs have incentives to hide money or to deflate figures to keep other players happier.
    • The press like round numbers, and sensationalised reporting presenting upwardly rounded multi year payments as a single number.
    • Some contracts have guaranteed and non-guaranteed money, with bonuses based on honours earned or game benchmarks.

    For historical contracts, extra payments outside the cap are obviously a difficult to identify factor. The Anthony Koutoufides contract reported in 2003 of $4m over 5 years turns out according to his agent at the time to have also involved 750k in under the table payments.

    Warwick Capper’s Brisbane Bears deal, already massive, was supplemented by valuable gifts from Christopher Skase such as a $200k vase and a clothing shop.

    So there’s a lot of caveats here, and now we can plough ahead, remembering all this should be taken with many grains of salt:

    As it turns out, Wanganeen-Milera’s two year contract at the Saintswill be roughly on par with the payment of Lance Franklin and Dustin Martin in terms of cap hit in the first year of the deal.

    Both of those were much longer deals with the amount of money managed across 9 and 7 years respectively, during which times the cap increased. At times both of those players may have been forming a smaller or larger share of the cap.

    For Wanganeen-Milera and the Saints, the cap hit is shorter term, which means less flexibility to spread the cap hit, but much more for the Saints to manage other cap space and recruitment.

    One player filling 10% of the salary cap may not be especially unreasonable considering we know that the top 3 players at the average club might get 20% and the top 6 might get over a third. The Saints have reportedly used salary cap banking in previous years to open up space for their current recruiting decisions, and the ability to defer other longer contracts into the future also exists.

    But make no mistake, the AFL’s (probably) first two million dollar man is being paid handsomely for his universally acclaimed talents, on par with a couple of the 2010s’ biggest superstars relative to the salary cap of the day.

    Around the Grounds

    • Gemma Bastiani on the W Show makes the case for recording an inside-30 stat for AFLW after the Crows showcased a lot of deep ineffective inside-50s in their surprise loss to the Saints.
    • Marnie Vinall’s ABC article about the impact of homophobia in sport is essential reading in light of the current situation.

  • Round 23, 2025

    Round 23, 2025

    This Week In Football is a collection of some of the best in football currently outside the walls of AFL clubs or broadcasters. Each week a curated grab bag from regular contributors and special guests will provide insight into and beyond the game on subjects of their choosing. For more about our contributors, click here.

    Banner images by Polly Porridge of the True Bloods Podcast. Check out her other design work.

    Before the Bounce

    There’s hype, then there’s this.

    Friend of TWIF Len Phillips found one of the weirder articles written on a AFL club website in recent years. Here’s a sample of it:

    TWIF can’t link you to the whole article because it has been nuked from the Lions website this morning. It is a wild ride of alleged bias and player acclamation. Luckily, it has been archived here.

    The article is somewhat emblematic of the race for AFL awards at the end of the year. In order to win many of the major panel-decided awards, clubs develop packs of support for nominated players. It’s arms length, but to best support the interests of fans and their players, clubs have to do a job in selling the strengths of each player.

    But that article is beyond that – a few steps past that line.

    Peter Blucher wrote that article, and one with a very similar tone about the snubbing of Harris Andrews from the All Australian team.

    That name may sound familiar to diehard, slightly older footy fans. The AFL Queensland Hall of Famer has had a long involvement in the game, from journalist to club media manager and finally player agent.

    It’s that last stop that was the one that drew the most public attention. In 2013 Blucher was suspended for a year for his involvement in the Kurt Tippett scandal, which caused Tippett to be suspended for half a season as well.

    That case was the linchpin on a crackdown on the behaviour of agents as well, although the actual face used for the crackdown was that of Ricky Nixon.

    It also wasn’t the last time his behaviour was questioned. In 2015 GWS asked for an investigation into his conduct relating to a hip operation on Adam Treloar around the time he was traded to Collingwood.

    A few years on, The Age’s Daniel Cherny broke the story around the alleged reasons around Joel Wilkinson’s failed return to the AFL. Blucher also features prominently in that one.

    This is all somewhat a distraction from the real issue – namely whether Ashcroft is in the mix for the Rising Star. Time will tell if that blank website can sway the voting panel.

    This week in football we have:


    How each AFLW side has been constructed

    Emlyn Breese / CreditToDuBois.com

    With Season 10 of the AFLW launching this week I wanted to have a look at how the 18 squads for 2025 have come together.

    There are 22 players still with their original Season 1 clubs, and each of the founding clubs has at least one original player – Adelaide having the most with 5.

    Carlton have made the most new additions for Season 10 with 10 new players – only one of whom comes from a previous club (Tara Bohana having played 31 games for Gold Coast).

    Brisbane have made the fewest changes with just three additions to their list – Neasa Dooley, Lilly Baker, and Claudia Wright all new to the AFLW.

    Melbourne have the most homegrown talent with 27, while Richmond and Essendon have the most players with prior club experience at 17.

    Essendon and Carlton both enter the season with 10 players yet to play a game for the club (Sophie McKay, Poppie Scholz, and Tara Bohana all played in the opening match of the season, so Carlton are already down to 7 uncapped players).


    AFLW State(s) of Origin

    Sean Lawson

    This is not an article about state of origin football, but rather a bit of a chart dump about where the current players in the two AFL leagues come from.

    So to start with, here’s how that looks. Thanks to Emlyn for supplying AFLW data to which I applied states of origin, while the AFLM data is slightly edited state of origin data from Fanfooty

    The most notable difference between the two leagues is that Queensland is, pretty simply, not a development state in the women’s game. There’s almost as many Queenslanders as Western Australians in the AFLW, buut there’s nerly 4 times as many Western Australians in the men’s league. 

    Queensland is not a part of the “Allies” at the girls’ under 18s championships but competes solo, finishing second in the standings this year.

    NSW and the ACT are also relatively better represented in the women’s game, which is in line with higher participation rates in adult women’s footy in the northern states.

    Western Australia’s relative lag is interesting here, and this may paint a picture of a relatively struggling women’s game out west. I noted with interest an interview with Canberran Swans player Lexi Hamilton, who described their recent star Western Australian recruit Zippy Fish as “raw” in coming from Perth instead of the development pathways in Victoria.

    The stronger women’s presence in NSW is especially the visible with regards to players from the north of the Barassi Line. A majority of male NSW AFL players (27 of 44) are from the south and west of the state, in line with the traditional strength of the Riverina and Murray regions and centres like Albury and Wagga. 

    By contrast, a large majority of NSW women in the AFLW (30 of 38) are from Sydney, or otherwise coastal or northern NSW. Riverina women’s football has been less developed until recently compared to, say, AFL Canberra, and most current AFLW players from southern NSW were recruited through intermediary periods playing in Canberra or Sydney.

    Unsurprisingly, the big states who play lots of football produce the most players, and when we convert over to per capita terms, the usual suspects predominate.

    Northern and southern NSW are shown separately here to give an indication of that traditional productivity below the Barassi line, where the Murray region is every bit as productive in men’s footy as Victoria itself.

    Also notable here is Ireland, not a state of Australia, because the roughly 7 million people in Ireland currently have produced the same number of current AFLW players (38) as the similarly sized New South Wales.

    With such a lopsided talent balance across the country, one of the big points of difference for clubs is how many locally recruited players they have. 

    Overall, AFLW squads are generally from closer to home, which is a product of the state-based drafting across the history of the league until last season, where clubs often could not recruit interstate players at all. The lower payscale and short contract periods also made making long distance moves less feasible until very recently when pay (now 60k to 100k in four tiers) started to get into “living wage” territory.

    Only three clubs – Hawthorn, Essendon and Geelong, have a more local squad in the men’s competition than the women’s and the Hawks stand out for having the highest percentage of Victorian players in both the AFLW and the M.

    In line with Queensland’s much stronger women’s footy presence, the situation for Brisbane is completely inverted between the two teams, with one of the highest local content factors on its women’s team and one of the lowest in the men’s.

    In the AFLM, every Victorian club has more locally recruited players than every non-Victorian club, and the four clubs in NSW and Queensland all found over 70% of their playing lists in other states.

    On the AFLW side, North have the most international players, but with a strong Irish contingent taking professional opportunities on our shores, only four clubs lack any overseas players at all.

    Essendon has the most Tasmanians right now, with the likes of Ellyse Gamble and Daria Bannister probably on the phonecall list for the Devils in a couple of years.

    Away from their home states, Port Adelaide is a hotspot for Western Australians like Gemma Houghton and Abbey Dowrick, St Kilda has a contingent of Queenslanders including Jesse Wardlaw, and Richmond has a number of NSW/ACT players

    In the AFLM, both Carlton and Collingwood have lots of South Australians and the Dees, Dogs and Kangaroos all have 8 Western Australians. The Crows, partly with their Broken Hill connection, have the most NSW players away from Sydney.

    Finally, on the types of players recruited from different states, it turns out clubs are more interested in scrounging up talls from non-traditional markets such as Queensland, with over a fifth of all Queensland players being of the two metre variety, compared to 11% in the league as a whole.

    Men over 200cm tall are exceptionally rare and sought after by all sports. The AFL has pursued entire pathways in US college sport just to source more meat for the ruck grinder. 

    Oddly enough, South Australia has 17 men over 2m tall playing in the AFL compared to the larger Western Australia having just 11. TWIF’s own Joe Cordy has proffered the theory that the constantly successful Perth Wildcats are monopolising Western Australia’s limited supply of tall buggers, leaving the AFL coming up a bit short, and I am not going to argue with this assessment.


    King’s working forward in different ways

    Cody Atkinson

    There’s been a bit of a debate occurring through different parts of the footy community, particularly the one existing online and in talkback spaces. It centres around Ben King and what makes a forward valuable.

    Firstly, a tweet in minimal context (and a shout out to ESPN and what they do in the footy space – this isn’t intended as criticism or shade, just an example).

    This is indicative of the thinking – if a forward like King is just getting shots on goal and providing nothing else by foot, is he doing enough to be considered valuable. Are Gold Coast getting enough off a player as dynamic as King if all he is doing is getting shots on goal?

    This hits at an issue that Sean Lawson and I have explored in part before, but in relatively disparate ways – the lack of homogeneity of jobs across the ground, and the hidden parts that make players valuable.

    In short, not all tall forwards in a team are asked to play the same role, and not all tall forwards across the league are tasked to do the same thing. 

    In fact, it’s a question that we’ve asked AFL coaches over the past five years. Almost universally, it’s not goals or marks that matter the most, but instead playing the team role and competing. Here’s Dean Cox explaining what’s important from earlier this year:

    No – the competing part and getting the ball to ground (is the most important). So say a player takes two or three contested marks in a game – it’s a pretty good game you know. But the difference between not losing them or at least having them is really important because we want you to get the ball to ground. 

    “You want to be dangerous in the air and at ground level. The forwards are aware that it’s not just about their contested marks they take, it’s about how many times the opposition take it on us and we don’t get an opportunity to get inside and score from that.

    Without being in the huddle with Hardwick, there’s a fair indication that the job being asked of King is very different to that of other key forwards. Hardwick’s teams, whether yellow and black or red and red, have tended to anchor players deep to stretch defences.

    As footy has evolved it has become increasingly congested – vertical spacing forces defences to either leave dangerous players unattended or leave room for dashing runs and leads. Richmond used to isolate Martin, Riewoldt and Lynch, while King and Long seem to be the main options on the Coast so far.

    This chart shows the top 20 goalkickers this year in terms of total marks and the average distance from goal that their marks were taken. You’ll note that King is almost 30m per mark closer to goal than a player like Riley Thilthorpe. It’s a similar story when you break it down by contested marks too – King does his work deep, as he is asked. He’s also been one of the best talls at winning ground balls inside 50 – of that list of 20, only Jack Higgins has won more per game.

    He’s also one of the most clearly targeted inside 50 this year. Only Mitch Georgiades has been targeted more in total (noting potential issues with the data). When they’ve kicked it towards King when going inside 50, the Suns have been able to rack up 326 points – the most of any respective forward/team relationship in the league. This has come at the cost of raw efficiency, but sometimes there’s a place for raw volume as well.

    King is doing those little things right – maintaining space, providing a contest, preventing rebounds. Beyond his actual goal totals, he’s providing that focal point necessary for the Suns to start actually climbing up the ladder. We know that King can play higher up the ground and contribute more, as he’s done it before. But that’s (likely) not the job in front of him right now.

    The shift appears to have worked for the Suns. They’ve gone from having the second worst rate of generating scoring shots per inside 50 to ninth in the league. They’ve also gone from being one of the worst sides at allowing sides to march from their defensive 50 to attacking 50 to one of the better teams. The Suns are also generating the deepest contested marks of any side on average of any team, providing a clear indication of how they try to attack the field and protect on the way back.

    So let’s loop back to the question above – is King doing enough? The natural reaction might be no. But given how much better the Suns have been going forward (and the role he has played) the answer is likely yes. 

    More precisely, due to the difficulty of assessing how players are actually operating in different systems and how they contribute to success, we probably can’t get closer than “maybe”.

    Which would be the second most unsatisfying way to finish the article.


    The adjustment that could win the Western Bulldogs the Flag

    James Ives

    As the top nine AFL clubs prepare for one of the most even finals series in recent memory, the smallest improvements can be the difference between a first-week exit and a place in the Grand Final.

    At this stage of the season, dramatic transformations are rare. You are what you are. Health remains the most obvious factor in any late-season surge, but more subtle edges can be found in detailed opposition analysis, targeted role tweaks, and exploiting specific matchups.

    For the Western Bulldogs, their weaknesses are there for all to see. Opponents can exploit matchups in their backline, and their aggressive press leaves them vulnerable in transition.

    Luke Beveridge has experimented with solutions, such as redeploying their spare across different lines and adjusting the way they use their wings, but the problem is stubborn enough that some fans have resigned themselves to hoping the Dogs can simply out-attack their opposition.

    But perhaps the answer is simpler than it seems… 

    A small role adjustment for one of the AFL’s elite rucks, inspired by Collingwood’s use of Darcy Cameron.

    Tim English is far from a defensive liability. He averages 2.8 intercept possessions per game (6th among rucks) and 1.4 intercept marks (4th). He’s also kicked 13 goals this season, ranking 2nd in total goals for ruckmen. The issue isn’t what English lacks, it’s that he’s too balanced.

    The Bulldogs’ real problems lie in defence and transition. They don’t need their ruck drifting inside 50 to compete with Aaron Naughton and Sam Darcy. They don’t need him functioning as an extra midfielder on the spread. They need him prioritising defensive positioning and lending consistent support to an underweight backline.

    Cameron offers the blueprint. He positions himself behind the ball at all costs, rarely caught in between his opponent and his defensive responsibilities. This often places him in prime spots to intercept on the flanks and across defensive 50. English, by contrast, tends to generate most of his intercepts deeper inside defensive 50 or along the back flanks. Less proactive, more reactive.

    Possession heatmaps tell the same story. English gathers 14% of his disposals inside forward 50 and shows a higher concentration through the corridor compared to Cameron

    His mobility makes him a genuine asset around the ground, capable of presenting as an option forward or tracking back to defend. It’s his greatest weapon. But when deployed more like a pseudo-midfielder than a pseudo-key defender, it can create problems. 

    Take a look at this Melbourne transition on the weekend. After losing a post-clearance ground ball, Melbourne transition through the wing. English works back to support but is pinned to the boundary after an aggressive back-45 lead from Tom Sparrow. As Jack Viney is held up, English stays pinned to the boundary instead of switching and repositioning himself into the dangerous space. Viney attacks the hotspot, drawing the Bulldogs’ defenders towards Max Gawn, and Melbourne have just enough coverage to crumb and score through Harrison Petty.

    In finals, where margins are extremely fine, the Dogs can’t continue to be exposed inside defensive 50. By adjusting English’s role to mirror Cameron’s, sacrificing some forward forays for consistent defensive positioning, the Bulldogs could address their most glaring weakness without overhauling their system. In a finals series this even, that single tweak might just be the difference between another year of frustration and winning the flag.


    Around the grounds

    • Here’s another plug for the W Download podcast by Sarah Black and Gemma Bastiani, which now has all 18 teams previewed in its recent back catalogue. A must to know what to expect  from each team  this season.
    • Ever see a scorpion kick goal kicked by a player jumping for a hanger? Now you have.
    • On The Shinboner, Ricky Mangidis breaks down how Collingwood have used Dan Houston away from his former role, Carlton’s two gameplans, and Geelong’s use of the Jeremy Cameron attention.
    • The latest Footy A2Z video is about how the rules of the game looked back in 1859. Footy A2Z is a youtube channel with simple informative animated videos about the game’s history and mechanics.
    • Squiggle Football is out! This is author and footy analyst Max Barry’s AFL deckbuilding football management roguelike and it’s pretty good.
  • Round 22, 2025

    Round 22, 2025

    This Week In Football is a collection of some of the best in football currently outside the walls of AFL clubs or broadcasters. Each week a curated grab bag from regular contributors and special guests will provide insight into and beyond the game on subjects of their choosing. For more about our contributors, click here.

    Banner images by Polly Porridge of the True Bloods Podcast. Check out her other design work.

    Before the Bounce

    Every year football tends to enter a slight hibernation period in the middle of winter before awaking anew as spring slowly starts to poke its head around.

    With just four weeks left the season is very much alive, with some of the finest games of the season being fought out by finalists (think Collingwood v Fremantle) and non-finalists (St Kilda v Melbourne) alike.

    The race is on for most spots that matter – from the minor premier to the last finals spot. While there’s a couple of win break to tenth and eleventh on the ladder, sides right through to 14th have shown at least moments of brilliance.

    But some have claimed that the season has been dull, ignoring much that we’ve observed on the field. Despite renewal at the top end of the ladder and a fair amount of tumult as the season has progressed, there hasn’t been enough for everyone.

    Perhpas some of this is down to the lower number of truly close games than the last couple of seasons. Average game margins are up 2.5 points per game on last season. In addition, the number of games decided by less than a straight kick is down to 10% from last year’s 19%.

    But it’s worth noting how unusually close the past four seasons have been. Normal can sometimes be skewed by the extraordinary. And while there are fewer games that are extremely close, there are more than normal that are very close.

    And things only seem to be getting tighter week on week.

    As a famous philosopher once said: strap yourselves in.

    This week in football we have:


    Breaking Down Brisbane vs Collingwood

    James Ives

    It started with a deep intercept mark in defensive 50 by Harris Andrews, followed by six quick-release kicks to uncontested marks as Brisbane sliced through the corridor. Callum Ah Chee then found space inside 50, setting up Logan Morris to assist one of Henry Smith’s three goals.

    It was a stark contrast to the Easter Thursday match-up at the Gabba, where Collingwood’s defensive dark arts were on full display. They forced Brisbane wide at every opportunity and preyed on the umpires’ tightening of the 15m rule. Brisbane struggled to adapt to Collingwood’s aggressive front-half press and often found themselves caught in-between lengthening the ground and providing overloads on the 45s, making them vulnerable in transition when they turned the ball over. 

    This dichotomy in performances can be attributed to combination of factors; greater scrutiny of the stand rule; greater leniency of the 15m rule; Collingwood’s lack of speed in the front half, missing McCreery and Hill (sub); Brisbane making offensive adjustments to stay more connected to their deepest forwards; and finally, the MCG factor. 

    The last point is somewhat provocative and counterintuitive. How can a team based in Brisbane be better suited to the MCG than the primary occupants in Collingwood. Part of the answer lies in Brisbane’s style. At the beginning of 2024, they doubled down on their kick-mark approach, leading the league with 110 marks per game. They entered the Grand Final of 2023 winning only one of their last 11 games at the home of footy (which was the previous week’s preliminary final against Melbourne). Since the Grand Final loss, they’ve won six out of seven, turning the MCG into somewhat of a mini fortress. 

    The MCG provides Brisbane with the extra width and length to maximise the benefits of their control game. Give them too much space and they’ll pick you apart.  Over-correct and they’ll just play around you.

    Look at the video below, which analyses two plays that highlight the differences between Brisbane’s approach in round 6 at the Gabba and round 21 at the MCG. 

    To further emphasise the point, take a look Brisbane’s kick map across both games. In Round 6, Brisbane often got caught on the flanks, happily taking what Collingwood were willing to give up. Their profile looks like a two-hour session of circle work. 

    In contrast, round 21 looked a lot more like the Brisbane of 2024. Changing angles, attacking the corridor, using the full width and length of the ground, quick release kicks and still undefeated on the MCG.

    Maybe I’m wrong and guilty of being a resultist. Maybe I’m right, and Collingwood delivers another beatdown at the Gabba. Or maybe we’ll have to wait until Grand Final Day to find out.


    Luke Beveridge, enigma of the West

    Jack Turner | The Back Pocket | TheBackPocketAU

    As a player, Luke Beveridge never really planted his flag successfully.

    Beveridge played 118 games across three clubs (Melbourne, Footscray and St Kilda) without reaching the half century at any of them. No real personal accolades aside from making the Greek Team of the Century, almost purely to make up the numbers.

    His rise as a coach followed a less traditional pathway also. He didn’t move from playing into the assistant coaches box or try his hand coaching in the VFL, SANFL or WAFL. Instead, he went back to dig his heels in at grass roots level coaching St Bede’s Mentone in the VAFA. 

    When Beveridge arrived at St Bedes, they were competing in the C Division. His now-trademark style of emotional buy-in, and building a theme around the season took the Mentone Tigers to the Division C premiership in 2006, the Division B premiership in 2007, and ultimately on to the Division A premiership in 2008. If we paid as much attention to our amateur or semi-professional leagues in Australia as they do in some other sports, this would be the stuff of folklore.

    It became obvious to those paying attention that he had a knack for coaching, and was quickly snapped up by Collingwood’s AFL program alongside legendary coach Mick Malthouse, and was a part of the coaching panel that led the Magpies to their droughtbreaking 2010 premiership. St Bedes Meltone have still not won a premiership in any division since 2008.

    Beveridge then took a break in 2011 – a year that an “unbeatable” Collingwood side couldn’t get the job done against Geelong three times – before returning to assistant coaching at the top level, this time under Alastair Clarkson at Hawthorn, helping oversee the first two of the now famous threepeat, before a coaching spot opened up at the Western Bulldogs due to the retirement of Brendan McCartney. 

    When Beveridge took over at the Bulldogs, they were coming off of one of their worst three season runs in the modern era, with many tipping them to win the wooden spoon, due to just seven wins for the season and Adam Cooney and Ryan Griffin departing to Essendon and GWS respectively.

    Instead, the modern Docklands marvel that is Luke Beveridge impressed right from the get go, taking a plucky young Bulldogs side to a sixth-place finish. In just his second season, Luke Beveridge famously won a flag for the Western Bulldogs, something his predecessors had failed to do for 62 years prior.

    Since then the Bulldogs have continued to be thereabouts, but never quite finished the job. Even in 2016 they flew home from 7th to win the flag, and nearly did the same in 2021. One thing he does have over many other coaches who get scrutinised for getting the job mostly done but never completely is that he did win that first flag.

    The intangible that we have to consider when it comes to Luke Beveridge is the strange and nigh unexplainable Docklands effect. No Docklands tenant has made the Top 4 since 2009, and the Bulldogs are the only Docklands tenant to win a premiership since its first year of operation when Essendon had their famous 2000 season run and resulting premiership.

    This weird and near incomprehensible Docklands statistic makes it difficult to judge Luke Beveridge’s tenure when compared to other coaches. Against coaches who have lined up against him on multiple occasions, only five have a positive win-loss ratio, a further five have broken even at 50-50, and twenty-two have lost more than they have won against Beveridge’s Bulldogs.

    Another common criticism of Beveridge is his willingness to throw the magnets around and play players seemingly out of position. A phenomenon that has come to be known in footy circles as “Crazy Bevo”. But for any of the failings of Crazy Bevo’s magnet switches, there are just as many – if not more – success stories.

    Rory Lobb has been a revelation in the backline, Ed Richards was being touted as a Brownlow fancy a mere month ago after being moved from the backline to the midfield. Aaron Naughton and Sam Darcy were both seen as key defenders in their first seasons and yet the two look set to combine for over 100 goals this year.

    Outside of positional switches, there was outcry and mockery at the fact Beveridge didn’t have Daniel or Macrae in his best 22, especially once they were traded and were looking to have an impact at their new clubs early this year. In their stead has come the clear reason why. Freijah has been a clear upgrade on Daniel and Kennedy on Macrae, as the shunned two sat on the bench at their respective new clubs for much of the final terms in Round 20.

    The Western Bulldogs haven’t lost a game by more than ten goals since the 2021 Grand Final. No other team has a streak that extends back further than the start of 2024, with only seven teams – Bulldogs included – having not lost by ten or more goals this season. In fact the Bulldogs haven’t even lost a game by 50+ since their back to back 50 point losses to start off 2023 – a year they still almost stormed home to make finals.

    For all the talk of the miraculous list that the Bulldogs possess, people fail to look past the stars and into the role players. The team that just last week dismantled an in-form GWS side to the tune of 88 points included names like James O’Donnell, Oskar Baker, Lachlan McNeil, Caleb Poulter and Lachlan Bramble. At times this year, they have been joined by Nick Coffield, Ryan Gardner, James Harmes and Harvey Gallagher. This is meant as no disrespect to these players who have done a great job under Bevo’s guidance, but they are by no means walk up starts at any other club in the AFL.

    It is important to factor in many of these things when discussing both Luke Beveridge and the Western Bulldogs. It is easy to get caught up in their ceiling to floor ratio, and the games they have lost in recent years that they should have easily won, but when it is all laid out, Beveridge has one of the better modern coaching records, and remains the Bulldogs only AFL era premiership coach.

    Will Luke Beveridge’s Bulldogs side cause havoc in the finals series this year, and win another unlikely flag? It’s probably less likely than it is likely, but they boast two of the most unstoppable players in the league in Bontempelli and Darcy and nobody loves an underdog story more than Bevo. I don’t think many teams would be excited to face them in a last chance final.


    History doesn’t repeat itself, but it often rhymes

    Emlyn Breese / CreditToDuBois.com

    This is an excerpt from a longer piece published on CreditToDuBois

    Simon Goodwin’s tenure as coach can, more than any other, be defined by a rule. Fitting for the coach of the Demons that this rule would be 6-6-6.

    Round 1 2017 – Simon Goodwin’s first game as Melbourne Coach. The Demons take on Alan Richardson’s St Kilda. All time Saints great Nick Riewoldt kicks two goals in the first quarter continuing his long-running torment of Melbourne. The 6-6-6 rule isn’t even a gleam in Steve Hockings eye and Goodwin has up to 9 players starting in defence at times.

    This isn’t a flooding strategy though – as the ball bounces the spares move through the centre square to provide attacking options. It sees them win 10 consecutive centre clearances and helps turn the match with a run of 10 goals.

    Image: Fox Sports

    Four years later and as far away from a Round 1 twilight game at Docklands as you can get – the 2021 Grand Final in Perth. We turn to the middle of the match. Marcus Bontempelli has put his Bulldogs three goals up and Melbourne are on the ropes. A goal to Bayley Fritsch sees the margin closed and the ball returned to the centre. In less than a minute of game time the Demons rip the ball out of the middle and score a further two. Even more astoundingly, ten minutes later they do the same again, scoring three goals in the final minute of the quarter.

    The 6-6-6 rule means nowhere to hide and few ways for the Dogs to mitigate the damage. The result is the most astounding display of pure football since the peak of Geelong’s time under Mark Thompson, and possibly ever. Melbourne score 100 of the last 107 points of the match and Goodwin breaks the longest active premiership drought in the league.

    We move forward another four years, but like many stories we return to where it started. Docklands. Twilight time-slot. The opponents are once again St Kilda, although faces have changed or moved roles. Alan Richardson now plays confidant to Goodwin rather than competitor. Nick Riewoldt provides commentary as Nasiah Wanganeen-Milera anoints himself as the heir to St Nick in the St Kilda mythos with two last quarter goals.

    Like the Bulldogs four years prior, Melbourne finds their options limited in blunting a withering 9-goal onslaught. However, 6-6-6 still has an even more central role to play. Melbourne goes where few teams before have tread, and none with such dire consequences. They concede a free kick for a 6-6-6 infringement at the final centre bounce with scores tied. This leads to a Wanganeen-Milera mark and a goal after the siren to seal Goodwin’s fate.

    He would go on to coach the following week, and Brad Green denies the result played a part in his sacking, but it’s plain to see this is where Goodwin’s career at Melbourne was decided

    Throughout Goodwin’s coaching tenure his contribution to his game and club have continually and unfairly been diminished. Now is as good a time as any to look at his legacy.

    Taking the team to a preliminary final in 2018 was largely credited to the framework Paul Roos set up. Make no mistake though, this was light years away from anything Roos had coached.

    People finally gave Goodwin ownership of results when Melbourne finished in the bottom two the following year.

    The ultimate success of 2021 was attributed to hyperbolic assessment of Melbourne as one of the greatest playing lists ever assembled. Yet it was seen as Goodwin’s failing when those same players kicked themselves out of consecutive finals in 2023.

    Simon Goodwin took over from one of the more defensively-minded coaches of the modern era. Within two seasons he had forged the team into one of the most potent offences we’ve seen in a decade. He was then able to transform it once again into one of the greatest defensive sides in the game’s history. Most coaches don’t succeed in one style, yet Goodwin appears to be criticised more than anything else for not being able to guide a playing group through a third successful metamorphosis.


    Does a radically smaller ground change how AFLW games are played?

    Sean Lawson 

    A common take on social media is that AFL Women’s games would be better or higher scoring if played on a much smaller field. Presumably this notion is based on a perception that regular fields take too long to traverse for AFLW players’ kicking distances and running speeds.

    For people who believe in shrinking AFLW grounds, the first round of the AFLW presents a very special opportunity to watch some women’s footy under these very conditions.

    When Sydney host Richmond in their Round 1 clash at North Sydney Oval next Friday, viewers get to see the women’s game played on by far the smallest oval ever featured in either the AFLM or AFLW .

    North Sydney is uniquely small, and more distinct from other venues than anything else seen in the AFLM or AFLW. At 125 metres, it is a full 25 metres shorter than any other AFL ground in use in either league, and 35 metres shorter than the average ground.

    At 108 metres, it’s narrower than anything else except North Hobart Oval, though it’s relatively close to the narrowness of Norwood Oval’s width, a venue used in both the AFLW and AFLM.

    In terms of area, using the simple formula for an ellipse, North Sydney Oval at about 10,600m² is about 58% of the area of the largest ground (Cazalys in Cairns), and only about two thirds the area of a standard ground like Docklands. 

    For reference here is a sortable list of all the grounds being used in the AFLW this year and their dimensions:

    The centre squeeze

    So, how does the wildly small field at North Sydney impact footy? Most obviously, the shape of the centre square changes. A typical modern footy field features a 50 metre arc at each end and a 50 metre centre square, which obviously will not all fit here.

    Following the pre-2007 SCG strategy of arcs overlapping the square would look very odd here, and also create issues adjudicating the AFLW’s 5-6-5 centre bounce starting positions. 

    Instead, the solution devised is to squish the square end-to-end.This creates the opportunity for very unusual setups such as that employed by Chloe Molloy here:

    The truncated “square” means a starting forward like Molloy can get to the bounce well before the wings do, and even beat midfielders to the ball.

    Sydney don’t run this sort of approach as a full time measure, but here’s an example from 2023’s comeback win against GWS where Brooke Lochland comes in from the forward zone and gathers a hitout which on a full-sized field probably would have been collected by a midfielder:

    Tactical exploration of the centre rectangle has probably been limited by there only being one game per year at NSO. After round 1, the Swans move over to the vibes capital of the AFLW in Henson Park, while North Sydney Oval groundskeepers start developing a cricket pitch for Sixers WBBL games.

    As such, there’s only a modest benefit to spending very much time getting deep and creative on different centre bounce strategies which only work for the first week of the season.

    However, the very close arcs do remain available for centre bounce tactical switch ups, and are something to watch for from Sydney and Richmond at North Sydney Oval on Friday night.

    Footy’s dead space

    Does the tiny ground impact scoring? There’s only a small sample, but what we can say is is these games have not been especially high scoring so far:

    Teams have scored more at several much larger grounds, including the 2024 Swans v Richmond result game at Coffs Harbour. Coffs appears from footage and Google Maps measurements, to be a bit under 180 metres long, good for the longest venue in either league.

    A primary reason why NSO doesn’t see more scoring is probably that large parts of a footy ground are dead space at any given time. Most footy is played in an effective area quite a bit smaller than even the tiniest AFL fields. Here’s a shot from last season’s game at North Sydney Oval, ahead of a throw-in at the forward pocket:

    All players are bunched into roughly one quarter of even this very small playing surface. 

    Consider how we expect play to unfold here. A throw-in possession can only be kicked a certain distance, and players are positioned to get wherever a kick could go. At that point, there could be a mark or free kick, or a spilled ground ball. In either case, players will already be running to maintain the bubble around that new situation.

    There’s only so far, and so fast, the ball can go, and players work to keep ahead of that action. At all times, the players’ reading of the situation, their structures, and their anticipation, define the active play area, and it’s always an area much smaller than the entire field.

    Fully using the entire field all at once means getting the ball truly to the outside of the active bubble, which eventually results in a released player running into an open goal. It’s difficult to engineer that, and if it happens, the empty grass ahead of the play works the same and plays the same, regardless of dimensions.

    Vertical and horizontal space

    Intuitively, though, one would think that 35 metres less distance goal to goal would result in far more scoring just because less kicks are required to get there.

    Quick-end to-end play does occasionally take place at North Sydney, if things break correctly:

    If a team can chain together long kicks either by winning a few contests or well executed leads, the shortened space is certainly there to exploit, and the game will have moments of very rapid transition from end to end.

    However, just as often, the narrow width and short length of the ground combine to crush the available horizontal space and congest the game. Here’s Collingwood exiting defensive 50 towards the very shallow wings and finding themselves immediately with little room to move:

    This is fairly normal coverage by Sydney on a wide Collingwood ball, but note how in this smaller ground, the Swans players pretty comfortably occupy space all the way to the corridor and a little beyond. Switching play and shifting defences will be relatively difficult with only 109 metres of width.

    The lack of width, and the temptation of that short vertical distance, should often allow teams to hedge more strongly towards defending down the line roost kicks.

    All in all, when it comes to a shrunken AFLW field, there doesn’t seem to be a particular reason to think that knocking 30 metres off the end-to-end distance is enough to make up for the relatively easy width coverage also allowed. That roaming bubble of footy action can move both directions, but when it overlaps with the edges of the ground, it can afford defending teams more capacity to congest ahead of the ball.

    This isn’t to say that a smaller ground can’t have high scores, rather it’s just to say that like any other ground, scoring levels are probably dependent  on tactics and team attributes rather than the amount of raw physical space.


    Around the Grounds

  • Round 21, 2025

    Round 21, 2025

    This Week In Football is a collection of some of the best in football currently outside the walls of AFL clubs or broadcasters. Each week a curated grab bag from regular contributors and special guests will provide insight into and beyond the game on subjects of their choosing. For more about our contributors, click here.

    Banner images by Polly Porridge of the True Bloods Podcast. Check out her other design work.

    Before the Bounce

    Sometimes good moments in footy are good.

    Sometimes they come on the field, but there’s the rare off-field moment that raises a smile.

    Trigger warning for Demons fans.

    The utter insanity of the St Kilda comeback against Melbourne has to be seen to be believed. For all bar the most one-eyed of Melbourne fans it’s an example of footy at its electrifying best.

    That led to one of the better off-field moments of the season too.

    Lyon. Nas. Pub. Shoulders.

    There’s going to be a lot written on the future of St Kilda, Ross Lyon, Nasiah Wanganeen-Milera and physiotherapy treatments for men in their late 50s lifting other men on their shoulders, but sometimes you just need to enjoy the game as it comes.

    This week in football we have:


    Winning the close ones

    Joe Cordy

    After a bumpy start to Craig McRae’s first season at the helm of Collingwood that saw them struggle to a 4-5 record, success quickly followed. The Pies stormed home in the back half of the season, winning 12 of their last 13 home & away games to secure a top four spot with the lowest percentage since North Melbourne in 2007.

    What was truly remarkable about the run wasn’t the stark change in fortune, it was the trend that would come to be the defining factor of McRae’s tenure thus far: his side had a preternatural ability to win close games.

    In what must’ve felt like cruel irony, it all came apart in September. Collingwood lost to both of the eventual grand finalists by single goal margins.

    Season over.

    What seemed at the time like the beginning of a regression to the mean failed to materialise the next season however. Collingwood finished 8-1 in single-digit margin games, all culminating in the lowest combined margin from any premiership side to win three finals. 

    Even as their premiership defence fell apart due to an injury crisis that saw them miss the top 8 the next year, their record in close games held mostly steady (albeit allowing a couple of draws and just barely non-qualifying losses through the gates).

    Following their six-point loss to Gold Coast away and subsequent one-point loss to Fremantle at home, 2025 became the first time that this era of Collingwood have ever had a losing record across a season in games decided by a single kick.

    Some analysts of the game would tell you this was bound to happen eventually. There’s plenty of evidence that on a long enough timeframe, any team’s record in such games will regress towards a 50/50 W-L split, and that the results of such games are “mostly luck.” 

    Football, though, is first and foremost a game of skill. While there’s always variance game to game and moment to moment in how well a given player or team executes those skills, as well as elements completely out of your control, you can control enough to tip the scales in your favour. 

    What McRae and his coaching staff have identified and drilled into the team is the effects of chaos and control in close-game scenarios; namely, how much variance you let into the game

    When Collingwood are chasing a lead late they want to play as open and expansive as possible, even to the point of counterintuitiveness.

    Time is the enemy, and so congestion and stoppages must be avoided at all costs, even if it means letting the ball spill out of a tackle. You’re more likely to win back clean possession in open play than a stoppage, and if you’re going to lose anyway it doesn’t make much difference if it’s by one goal or two.

    Conversely, when Collingwood are aiming to defend such a lead, they want to reduce the variance by restricting the amount of football that can possibly happen.

    Time is the enemy, and so congestion and stoppages are the best way to kill it. Search for the boundary, eschew first possession at stoppages so that you can descend on your opponents when they win it, and either continue to clog up the game or win possession back via free kick.

    The principles of it are simple, but nothing comes easily after being physically and mentally drained by running a dozen kilometres and making thousands of small decisions in a brief 2-3 hour window.

    The importance of keeping your clarity of mind was arguably never clearer than during the last ten seconds of Round 20, when Melbourne had lost sight of their rotations so badly they gave away game-defining 6-6-6 free kick, while St Kilda’s star ruck and midfielder coordinated a set play to create an uncontested marking opportunity inside forward-50.

    However, Collingwood’s edge in this area has started disappearing. Not due to fatigue or absentmindedness, but opponents copying their homework. Some of the earlier adopters have looked pretty inelegant, like Sam Draper diving onto the footy and seeming to dare the umpire to call him out on it. 

    Collingwood’s recent match against Fremantle must’ve felt like looking into a mirror.

    While they tried to open up space and get the ball forward by any means available, they faced a team running McRae’s “kill the game” playbook almost to perfection: pinning the ball at arm’s length to create stoppages without dragging it in, hanging off opponents and conceding first possession in order to wrap them up, handballing along the ground to keep the game congested, even descending on their own grounded teammates to make sure the ball doesn’t go anywhere they don’t want it to. 

    It was a genuine masterclass on both sides of the equation, but more importantly it was the clearest example that the tactical niche McRae has carved out for himself is quickly vanishing.

    Collingwood will still have a massive edge in these situations against disorganised, flustered opponents, but they’re unlikely to ever put up records like 8-1 in these situations again. It’ll probably look like a run of bad luck.


    How about a 186cm Full Forward?

    Cody Atkinson

    Are we ready for Jake Melksham, key position forward?

    Well it doesn’t really matter if we are ready or not – the time is here.

    source: afl.com.a

    But how did we get here – whatever this place is?

    When this TWIF correspondent watched the surprisingly enjoyable Carlton/Melbourne game at the MCG in round 19, something slightly peculiar stood out. No points for the guess here – it’s how Carlton responded to how Melbourne were using Jake Melksham.

    The Demons planted the former Bomber deep in the forward line – often as the closest forward to goal. That’s not particularly unusual across the league. Many sides throw a smaller option deep towards goal to throw the traditional defensive set up off kilter. Charlie Cameron played that role regularly for Brisbane’s most dangerous forward lines, for example.

    Usually this attempt succeeds, and the tall defender usually assigned the deep anchor role is forced up the ground to follow taller timber. In theory it diminishes the ability of the attacking side to take contested grabs inside 50, but it helps generate space and cause disruptions.

    Melksham has also been one of two dangerous forwards for the Demons all year – alongside Pickett. Fritsch has had his moments, but the stocks have been pretty bare this year.

    As alluded to above, Carlton didn’t respond in the usual way. They didn’t stick a small or medium sized defender on Melksham. Instead, they tasked All Australian key position defender Jacob Weitering on him. In isolation this matchup worked for Carlton – Melksham managed just one goal for the game and one mark inside 50, with Weitering hoovering up 6 intercept marks.

    TWIF asked Voss about the match-up after the game.

    “How important is it to have a tall (Weitering) that is mobile enough to go with someone, I guess, you know, half a foot a foot shorter than him? 

    Yeah, he’s a big man. So to get past him is a bit of a challenge. You want to be able to build a defense that can play tall, small – take their turns when they need to. That seems to be what modern defenses are all about. Play a little bit more with where your relevance is to the ball and where your strengths lie…At the same time, we’d like him further up the ground doing what he does best, which is obviously generating and interrupting opposition’s passes of play.”

    For the Demons the tactic is likely bourne out of desperation – a lack of reliable talls to direct traffic through. This make Voss’s response to the situation easier – without multiple credible tall targets deep, it becomes easier to place the most mobile one on the deep anchor – even if that anchor is on the smaller side.

    So how does this all relate to Jake Melksham, 186cm KPP?

    It’s worth noting this is the first year that Melksham is considered to be a tall forward. That’s down not to just how Melbourne have used him, but also how teams like Carlton have responded in kind.

    It turns out that some player classifications are determined not just by position on the ground and particular nominated roles (such as ruck), but also by the players that are determined to match up on them. Champion Data employees callers at the ground to not only determine what happens on the field but also on field matchups. These matchups are relatively rigid and static. The nature of the role perhaps doesn’t reflect how modern footy is played – but that’s a tangent for another day.

    @sportsgrad_

    So, you’re telling me I can get paid to watch footy 🤯  We went behind the scenes with Champion Data to see just how they tell the story of the game and deliver live stats to you in seconds ⚡️  Follow us to learn more of some of the most epic jobs in the sports industry! #jobsinsport #championdata #afl #aussierules #analytics #dataanalytics #fyp

    ♬ original sound – SportsGrad

    It’s these matchups that feed into the player classification model. The type of forward (key or general) is determined not just by where they line up on the ground, but also who lines up alongside them. Because sides like Carlton have sent KPDs to mind Melksham, Champion Data have determined that the small to medium sized forward is actually tall.

    Determining player positions is tough in modern footy. The days of the standard footy field grid are long in the past when looking at how teams actually operate on the park. Interim measures – such as the Champion Data classifications – are increasingly being stretched by inventive coaching and game evolution.

    Further research is being done at both club level and by independent analysts. TWIF’s own James Ives has teased different player classifications, while former legend The Arc developed his own model way back in 2016.

    Or maybe Jake Melksham is just a 186cm KPP? Probably not, but maybe?


    In the margins

    Emlyn Breese / CreditToDuBois.com

    What statistics are correlated with winning and losing in season 2025? And how do those correlations differ for different teams with different strengths and game styles?

    This article comes with an acknowledgement and a few disclaimers. I wouldn’t have been able to do this without the incredible work of Andrew Whelan of WheeloRatings.com – having such a rich data source as a base meant I could take the time to pull together the analysis.

    The disclaimer, for the purposes of this piece, is that I’ve used really simple linear regression with r2 as the basis for determining correlation. It’s not something you’d use to try to put a predictive model together, but it does enough to allow us to draw some interesting points.

    Another disclaimer is that correlation is not causation, and doesn’t establish directionality. For example, West Coast’s margins are more strongly correlated to their ruck output than the rest of the league. Is that because when Bailey Williams and Matt Flynn have managed to win the battle, Harley Reid is able to go to work, or is it that an opposing ruck getting bested by them is emblematic of a team ripe to be beaten by West Coast?

    It could also be that a given stat is a real non-negotiable for a team, it’s something they can be relied to win week in week out regardless of the end result – which would be reflected in a low correlation. The data can hopefully lead us to some interesting points for discussion, but can’t be definitive one way or the other.

    Lastly,it is worth noting that I have used stat differentials (team minus opponent) rather than raw stats when correlating to margin, so keep that in mind.

    With that out of the way, let’s get into the statistical correlations.

    As you’d expect, kicking more goals than your opponent is very strongly tied to the final result. Champion Data’s rating points are also very closely correlated.

    We can see that xScore has a higher correlation with victory than the pure number of shots, which we’d expect from a measure that incorporates not just the volume but the level of difficulty of shots taken.

    Among score sources, Points from Turnover appear more valuable than Points from Stoppage, unsurprising as turnover is the primary scoring source. Points from forward half are a better predictor than points from defensive half.

    xScore rating, that is how well the teams are executing on the shots at goal they generate, appears to be worth about as much as a gap in uncontested possessions, which is a better predictor than contested possessions or clearances.

    Commit more clangers than your opponent and you’re likely to lose, however the correlation is relatively weak (to have a clanger you’ve generally got possession first).

    Defensive half pressure acts is a rare example of a “positive” stat with a negative correlation to margin. If you’re racking them up, it means both that the ball is in your defensive half and the opponent has control of it.

    We’ve got the league averages, so where and how does each team diverge on individual statistics?

    The arrow indicates the direction a team diverges from – a red arrow to the left means that stats correlates less (or more negatively) with margin for the team than for the league at large and blue indicates stronger correlation.

    Adelaide win through having a better spread of goalkickers than their opponents. They’ve had more unique goalscorers on 10 occasions for an eye-watering average margin of +62 points. Handballs are more valuable in their games than average, and kicks less so. The gap in value of points from forward half compared to defensive half expands.

    They also don’t rely on a high mark inside 50 differential as much as the rest of the league. To revisit our disclaimer, this doesn’t necessarily mean they’re bad at it, just that it hasn’t correlated with winning and losing to the same degree it has for other teams. Adelaide has lost 5 games for the year – in three of them they won marks inside 50 and in a fourth they drew. They’ve lost marks inside 50 three times, and won two of those games. They’ve drawn it three times for a three point loss and two 10+ goal wins. They’ve also managed to win by 10+ goals with a +0,+0,+1, and +2 marks inside 50.

    Brisbane aren’t converting xScore into wins particularly well (because they’re 4th worst in goal accuracy this year). They’re getting more value from centre clearances than most teams, and appear to not be as affected by turnovers. This is partly driven by the fact that they haven’t had a turnover differential larger than 8 in the positive or negative whereas a quarter of games league-wide have blown out past this.

    Carlton don’t often lose more defensive 1 on 1s than their opponent, only on four occasions so far and never by more than two. Their biggest wins against West Coast and North saw them win the stat by 6 and 4 respectively. When they’ve been required to make more defensive half pressure acts than their opponent however they’ve got an average margin of -24 compared to +20 the other way. 

    Similar to Adelaide, Collingwood benefit from having a better spread of goalkickers than their opponents. All of Collingwood’s losses have come while winning the inside 50 count and three of the four came while also winning the marks inside 50 count, including a three point loss to Geelong while recording their best differential for the year (+9).

    They’ve only lost the tackle count once all year, in their opening round drubbing by GWS. While they recorded a solid +21 tackles in their 1 point loss to Fremantle, the other two losses saw low differentials (for Collingwood) of 8 and 10. Three of their four biggest wins have matched up with their three biggest tackle differentials. Their pressure game also helps explain why they can lose the kick count convincingly and still come out on top. 

    Essendon want clean hands. Their average result is a 47 point loss when recording more ineffective handballs than their opponent, compared to just a 9 point loss when recording fewer. This is mirrored in effective disposal tallies. It’s not surprising, decimated by injury my best guess is that they just don’t have the drilled structures in place to respond to errors so when things go bad there is little damage mitigation.

    It’s been a common theme of criticism that Fremantle can tend to rack up meaningless uncontested possessions. They’re 7-3 in games they win the count and 6-3 when losing it, but with a slightly better average margin. By comparison their average margin when winning contested possession is +26.2 compared to -10 when losing it.

    Geelong benefit from winning the intercept game as well as tackles inside 50. When the Cats have recorded +8 tackles inside 50 or better they average a 65 point win. On the two occasions they’ve achieved -8 or worse they’ve lost by 18 and 41. They also don’t mind getting on the positive end of some xScore variance. Points from stoppage aren’t as big a predictor for them as others.

    Gold Coast are towards the bottom of the league for post-clearance ground ball, but they’re 8-1 when they’ve won the stat. They boast the same record when winning crumbing possessions, but are dead average in the stat across the season.

    GWS have only won points from centre bounce in 6 games this season, but they’re 6-0 with an average margin of +45 when doing so. They’re not as dependent as most teams on building an xScore advantage to win, because they outperform their opponents on xScore rating by a maddening 10+ points per game.

    I’ll be back next week to step through the remaining nine teams as well as hopefully looking at which teams do or don’t have their performance captured well by Rating Points.


    Comparing this year’s finals race

    Sean Lawson

    The race for finals is down to 9 teams with a month left to play in the regular season of 2025. Sydney’s loss to GWS dropped their already remote finals chances to the purely mathematical realms involving multiple wooden spooner upsets, two collapsing teams, and improbable percentage boosts.

    The remaining equation is pretty simple. One team from the top 9 is going to miss out, and after the Dogs smashed GWS last night, there’s 4 teams (GWS, Hawthorn, Freo and Bulldogs) with a decent chance of missing the cut.

    With 4 weeks of the season to go, this is unusually early for so few teams to be in the hunt for finals in the 18 team era.

    The peculiarity of this season’s ladder is naturally being used to argue for an expansion of the finals to ten sides, so more teams can avoid dead rubbers for longer. However, Greg Swann appears to see the 10-team finals series as a change to be made when there’s 19 teams.

    Most years since 2012 have seen several clubs still in close contention for catching 8th spot. Indeed, some recent seasons have still seen the team as far adrift as 13th a viable chance of qualification, although on average, the top of the bottom 6 has been more than three games behind the pace.

    2016 was the last year where so few teams were in contention for finals a month out. In 2016, there were three games separating North Melbourne in 8th from St Kilda in 9th. Funnily enough, this was the season where North opened by winning 10 of their first 11, and by August were in open free-fall. North failed to win another game after round 20, and the Saints only missed finals on percentage.

    If making up 1 or 2 games on 8th is reasonably possible with a month remaining, most years we can expect up to four teams to still have fans furiously running their ladder predictors and death riding certain opponents.

    This year, all of the calculation of permutations is confined to the top 9 sides. The big reason there’s such a small chasing pack this year is that the fringe finalists are simply losing fewer games.

    This year is the first season since 2018 where the team in 8th has only lost 7 games to this point. Further, with the longer season thanks to Gather Round, the Suns on 12 wins are the winningest 8th place team yet seen in the 18 team era.

    A further consequence of the success of the teams ranked 5 to 8 is that a winning by teams outside the top 4 is that the actual positional spread within the top 8 is quite close at the start of Round 21.

    Those stronger results for the bottom few teams, and the lack of a runaway ladder leader, mean nearly everything is still up for grabs.

    The last few weeks of the season should be a tight jostle for home finals and double chances, everyone in the finals race has winning form to point to, there’s no clear single standout leading team, and it’s honestly strange that so many commentators seem to think that this all constitutes a “dismal” or “boring” season. 


    Around the Grounds

  • Round 20, 2025

    Round 20, 2025

    This Week In Football is a collection of some of the best in football currently outside the walls of AFL clubs or broadcasters. Each week a curated grab bag from regular contributors and special guests will provide insight into and beyond the game on subjects of their choosing. For more about our contributors, click here.

    Banner images by Polly Porridge of the True Bloods Podcast. Check out her other design work.

    Before the Bounce

    A small moment in the aftermath of Carlton’s win over Melbourne last weekend went largely unnoticed except by those who pay attention to post-match press conferences.

    There’s a good reason that most people don’t pay attention to press conferences. This was one of the exceptions.

    At the end of the journalist questions, Michael Voss took a moment to speak about the Carlton Respects program, a community program the football club funds, focused on educating about gender equality as a tool to combat gendered violence.

    It is a serious subject that requires more focus, and more broad attention. Gendered violence is a societal problem that requires real discussions and policy solutions. Football is a just a game, but it is at its best when it mirrors and assists society at large.

    It probably says something about the perfunctory and rote nature of many press conferences that this went by without much further attention.

    This week in football we have:


    A deeper dive into the Threat Index

    James Ives

    Last week, I unveiled the Threat Index, which attempts to identify how threatening teams are across the course of a match. The Threat Index can also guide us on how well teams capitalise on a combination of territory, possession and shots at goal.

    This week, I will detail which teams concede the most goals against the run of play and the games with the biggest margin-threat differentials where a team has lost the game with greater threat.   

    Part 1: Brisbane’s Achilles Heel 

    For years, Brisbane have been dominant in both their transition ball movement and their ability to generate forward half turnovers. If there is one criticism of their game, it’s their inability to capitalise on their field position. In season 2025, almost 40% of opposition goals are scored while Brisbane has greater threat. This is one of the highest returns over the last five years.

    It helps explain why I’ve left a couple of Brisbane games wondering if I read the scoreboard incorrectly.

    Part of this is a result of their aggressive front half press, which explains why we also see other dominant front half teams, such as Collingwood, with high percentages. Interestingly, Melbourne and Carlton both concede similarly high percentages, albeit with much less territory and possession than the likes of Brisbane and Collingwood. 

    Part 2: The Back Breakers 

    That leads into a broader type of game – where a team wins despite the flow of game being against them. Here is a list of games with the biggest differentials between threat and margin.

    Gold Coast’s round 19 horror loss against Adelaide comes out on top.  We can see a critical period early in the game between Adelaide’s 2nd and 3rd goal in the visualisation below.

    In this five-minute stretch, Gold Coast had eight inside 50s to Adelaide’s two, and three shots to Adelaide’s one – which was generated from a kick-in and resulted in a Tex Walker banana from the pocket with an expected score of 2.3. A truly soul-crushing goal against the run of play. 

    Part 3: The Threat Leaders 

    The threat ladder shows Brisbane sitting atop, led by their dominant possession and front half game.

    Carlton and Melbourne sit just inside the top 8, highlighting their inability to convert territory into scores. While GWS sit 13th, highlighting their ability to absorb positional pressure and their counter-attacking prowess. 

    As always, please send through any requests, feedback or questions.


    Where it all begins

    Emlyn Breese / CreditToDuBois.com

    Centre bounces are one of the things that sets Australian football apart. Not so much for the novelty of the bounce, but because after a major score possession is reset to neutral. In most sports play restarts with the ball in possession, whether alternating (e.g. netball) or given to the team who conceded (e.g. basketball, soccer).

    That makes centre bounces an incredibly potent weapon. There aren’t any brakes that the rules applied, only what the opposition can summon. A patch of dominance can reshape the course of a game in mere moments.

    Who’s delivering at centre bounces this year then?

    Getting the clearance isn’t the only way a player can contribute at a centre bounce. First possession is important, rucks can add a lot through hitouts to advantage, and defensive pressure is critical. For the purpose of a single number to measure impact though clearances work pretty well.

    Centre bounce attendance and clearance rate, 2025

    As expected, down the bottom right in the “high attendance, low clearance” group we see the primary rucks. Solo rucks are there 80% or more of the time, but they’re generally not going to be winning clearances themselves at a high rate.

    Above that we’ve got some of the other heavily used midfielders. Caleb Serong stands out among them as the only player attending a high number of clearances to keep a clearance rate (clearances / bounces attended) above 15%.

    The top left is where things probably get the most interesting. We’ve got three players who have attended (relatively) few bounces this year but when they do are making things happen at an alarming rate.

    Going back as far as 2021 (and limiting only to players with 100+ CBAs in a full season (or 75+ so far this year), Nasiah Wanganeen-Milera, Joel Freijah, and Cam Rayner are the only players to have a clearance rate above 20% across a season (Paddy Dow finished with exactly 20% in 2023).

    How these three got to their CBA numbers is quite different though.

    Centre bounce attendance by Freijah, Wanganeen-Milera and Rayner by round, 2025

    Wanganeen-Milera has had four games with 40%+ attendance, including 79% last week, his other 14 games have seen two in the 20s, three below 10%, and the rest with no attendances. It seems clear the Saints are looking to build into him the capacity to be an elite primary midfielder, rather than a half-back who rotates through.

    Freijah on the other hand has seen between 20% and 40% of bounces in 11 of his 18 and attended at least 5% every week. Rayner is somewhat similar, although with a higher floor and lower ceiling, all of his games falling between 7.7% and 25%.

    This brings us to the question of how teams are sharing the load more generally.

    Club centre bounce attendance distributions, 2025

    The chart is ranked in ladder order as of the end of round 19. Teams where the dark colour extends further right represent a higher concentration of CBAs among a smaller number of players – for example 93% of Brisbane’s CBAs have been taken by 6 players – Neale, Dunkley, McCluggage, Ashcroft, and the two rucks in Fort and McInerney. By comparison Essendon and West Coast use 13 and 12 players to fill out the first 93% of CBAs.

    What does it mean to have a settled centre bounce lineup? To be able to distil down into a single number I’ve chosen a measure of what % of centre bounce attendances are filled by the first 8 players across a season. This is arbitrary to an extent, but looking through the data appeared to give a reasonable point of separation between teams. It then allows us to compare it to an output – centre clearance differential.

    Centre bounce attendance differentials vs centre bounce attendance concentration since 2021

    We can see two things. Firstly a higher proportion of CBAs from a core group appears to correlate to a better centre clearance return. This matches intuition, one of the primary drivers of a high concentration of CBAs is health. Having your top tier midfielders available throughout more of the season will naturally yield better results.

    The second is that over the last 5 seasons CBAs have become more concentrated among a smaller group of players. Four of the 9 most concentrated CBAs occur this year – although for very different ladder results with the teams being Brisbane, Adelaide, Melbourne, and North Melbourne. 

    We also see Richmond and Port Adelaide as the most concentrated teams to have averaged a -1 differential or worse further showing that consistency alone isn’t a guarantee of even centre bounce results.


    Big Docker has you fooled

    Sean Lawson

    What’s a “big club”?

    There’s a well understood hierarchy in Victoria with the “Big 4 clubs” at the top being Collingwood, Essendon, Carlton and Richmond. These clubs have the largest fanbases, long histories of success and the most money. At the other end are the Docklands tenants (derogatory) who have small fanbases, lower profiles and more difficult histories. Regional Geelong and nouveau riche Hawthorn somewhere in the middle.

    But what about the rest of the country?

    It is generally also understood that West Coast and Adelaide are very rich and powerful clubs, by virtue of their large market share in the second and third cities of Australian football. After that though, perceptions and characterisations by fans and media tend to get a lot murkier.

    I decided to test public perceptions of the middle cases by asking twitter followers:

    As it turns out, most people see the second teams in Adelaide and Perth as “small” clubs, but quite a few more see the Lions in Brisbane as a bigger club.

    This didn’t surprise me because I think it quantified something I’ve long noticed about the Dockers: most fans think they are effectively a “minnow” club, and this may even include a bit of an inferiority complex within their own fanbase.

    The reasons for this perception aren’t difficult to understand. The Dockers had a tortured early history, while existing in the same city with the bank-breaking death star of a club that is West Coast.

    And of course, the Dockers haven’t won a flag, whereas the Lions have won 4. Premierships create the perception of power and size, even if Essendon exist to remind us that money doesn’t buy football happiness in the modern world.

    To a certain extent this underdog branding is also how the club positions itself – scrappy battler, ignored by other fans and the media, set up to fail from day 1, disrespected and treated poorly, starved of success.

    This perception is, however, all an illusion. By most reasonable metrics, the Dockers are not just middling, but a powerhouse of a clubs.

    Most obviously, Freo are one of two teams from a pretty big city, one not much less than half the size of Australia’s largest city, Melbourne.

    Perth is footy’s second city and quite a lot larger (and richer) than Adelaide. If we assume the club split in both cities is about 60:40, then the smaller share of Perth is larger than majority share of Adelaide.

    On the strength of this background alone, we have to suspect that even the smaller team based out west has to be doing pretty well for itself.

    And that scale of population translates into fans. Fremantle’s crowds have been persistently huge for years now. They used to fill Subiaco pretty well and right now, with the Eagles at a low ebb, they’re even outdrawing the cross-town megaclub.

    Indeed, Freo are outdrawing everyone else except Collingwood right now. That’s when we measure each club’s own fanbase in isolation by excluding games where both teams are based in the same city and both fanbases are contributing to the crowd figures:

    Money-wise, Fremantle is a fairly well-off club, too. The AFL distributes shares of broadcast revenue to all clubs to enable them to fully fund their football programs to clubs. Small needier clubs receive more revenue and larger clubs receive less.

    These distributions serve as a rough (but not exact, given differences in operating costs and the like) guide to how the AFL has measured each club’s financial capacity:

    Fremantle are among the clubs considered to need the least support, as befits a big team in the second city of football.

    Note that on the other hand, the Lions receive a lot of support from the AFL, as they have done since equalisation really took hold around 2015. The Lions are based in a development market and were heavily impacted by the introduction of the Suns, with membership and crowd data indicating that perhaps a quarter or more of the Lions’ attendance base (presumably concentrated in Gold Coast) was lost to the Suns. That impact would have amounted to several million dollars of revenue a season.

    Fremantle’s financial health is of course largely because, with those huge crowds and a large, rich and football-obsessed city at their back, they generate simply a lot of money from football.

    This is my best estimate of the relative “profitability” of each club’s football operations, from an article earlier in the year. It is the money they make from sponsors, memberships, gate, merchandise, after the costs of providing these things are deducted:

    With their lack of silverware, their powerful neighbour, their off-broadway TV timeslots and low profile in Melbourne, Fremantle might not feel like a powerhouse club. But perception isn’t reality. They aren’t West Coast, but the Dockers are massive. Don’t let them or their enemies trick you into thinking otherwise.


    Around the Grounds

  • Round 19 2025

    Round 19 2025

    This Week In Football is a collection of some of the best in football currently outside the walls of AFL clubs or broadcasters. Each week a curated grab bag from regular contributors and special guests will provide insight into and beyond the game on subjects of their choosing. For more about our contributors, click here.

    Banner images by Polly Porridge of the True Bloods Podcast. Check out her other design work.

    Before the Bounce

    Can you really boss football?

    There might never be a definitive answer to that philosophical issue. In the meantime Greg Swann will be tasked with what might be one of the hardest jobs in the code.

    As of Monday, the former Brisbane Lions head honcho steps into AFL House in a newly created “Football Performance Executive” role in the executive suite.

    Similar jobs have created vitriol for those who have sat in the chair. Names like Hocking, Scott and Kane have been spat out in colourful terms by those in the outer whenever any change to the game is made.

    Swann will rapidly become the face of the changes that will inevitably be made to the sport in the coming years. Swann has already flagged the “speed of game” as something that may need to be addressed. Concussions and head knocks also continue to be a major issue, with contact and tackle rules surely being investigated for potential change.

    Whatever decisions the league makes, there will be an element of footy fandom that just wants the game to return to what it was. Keeping those people, the clubs, the media and the rest of the AFL executive happy is a tough tightrope to walk.

    Swann will have a tough job ahead in an increasingly combative football conversation.

    This week in football we have:


    If only there was an easier way to talk about goalkicking accuracy

    Lincoln Tracy – @lincolntracy

    Last week there was an article on the AFL website that praised the goalkicking accuracy of the Greater Western Sydney Giants at their home ground, Engie Stadium (the Sydney Showground), compared to how other teams perform at the venue, as well as the league-wide average:

    “For the past four seasons, the Giants have an accuracy rate of 54 per cent at home, while the opposition convert at just 43 per cent at Engie Stadium. The League average in that time is 49 per cent, meaning the Giants at home are well above AFL average, while their opponents are well below it”

    This piece raised a few eyebrows among some of the contributors to This Week In Football, primarily because it focused solely on goalkicking accuracy (goals vs behinds) and made no mention of the expected score (or xScore, for short). 

    If you’re not familiar with the term, the expected score concept looks at every shot on goal each team has over the course of the game and calculates how many points each shot should have scored based on historical scoring data. The historical data considers a range of factors when determining the xScore, including how far away from goal the player is, the angle of the shot, whether they are taking a set shot or are under pressure.

    Different analysts and organisations have created their own xScore models, including Andrew Whelan (Wheelo Ratings), Adam Tunney (AFL xScore), and ESPN. But ultimately all of the models indicate whether individual players or teams have scored more or less points than what they should have. It’s a more sophisticated way of looking at scoring among AFL teams compared to simply looking at goalkicking accuracy.

    And we don’t have to look too far back in order to find a game that highlights some of the differences between goalkicking accuracy instead of something slightly more sophisticated: the clash between Hawthorn and Fremantle in Round 18, where Fremantle won by 15 points. The Dockers were more accurate from a goalkicking perspective (12 goals, five behinds from 17 shots at goal; 60%) compared to the Hawks (nine goals, eight behinds from the same number of shots, 40.9%).

    However, Fremantle under-performed from an xScore perspective while Hawthorn essentially scored as expected – primarily because of the very small number of shots from high-value positions. Andrew Whelan’s shot map (below) highlights this quite nicely. 

    Credit: Andrew Whelan

    So now that we have a better idea of what xScore is and how it is more nuanced that goalkicking accuracy alone, let’s look to see how the Giants (and their opponents) perform at Engie Stadium with respect to xScore using Adam’s AFL xScore data over the same timeframe as the original article (2022 to 2025).

    Over the past four seasons Greater Western Sydney have exceeded their expected score by an average of at least 4.9 points while playing at the Showgrounds, and have exceeded their expected score in over half of the games they have played. This is well above what is seen for their opponents and the league more broadly with respect to both the average difference between the expected and actual scores, and the proportion of games where the actual score exceeds the expected score.

    Examining the xScore data also shows that the Giants’ performances at the Showgrounds in 2025 is somewhat of an outlier compared to other years, unlike what is seen when we only consider goalkicking accuracy. GWS have kicked goals from more than half of their shots in four of their six games at the venue so far this year and exceeded their expected score in all but one of the games.

    The two matches with sub-50% goalkicking accuracy were the Opening Round clash with Collingwood and their Round 10 encounter with Fremantle, while the Fremantle game is they lone match where they did not exceed the expected score. Astute observers will notice that the Dockers clash is the one game the Giants have lost at the Showgrounds this season.

    It’s a much different picture at Manuka – the Giant’s home away from home, however. GWS perform significantly below average on each of the metrics, and their opponents seem to have good years and bad years when playing in the nation’s capital. It therefore comes as little surprise to see that the Giants have a much better record at the Showgrounds (19-10) compared to Manuka (4-12) over this period of time. Fans of the orange team will take some comfort in the fixture, with the Giants slated to play two more games at their home base in Sydney and only one more in Canberra. 

    Other teams who have significantly outperformed their opponents on xScore are Sydney at the SCG (average difference in proportion of games above xScore of 23%, even with there being no difference to this point in 2025), Hawthorn at York Park (+21%), and Adelaide at the Adelaide Oval (+20%). At the other end of the spectrum, Melbourne at the MCG (-17%), Brisbane at the Gabba (-19%), and Richmond at Docklands (-38%) tend to score below their xScore more frequently compared to their opponents.


    Building a Threat Index

    James Ives

    Is there a more frustrating sequence as an AFL fan than when your team concedes a goal against the run of play?

    Every fan has experienced it before. A sustained period of territory and possession dominance, only for the opposition to slingshot down the other end and score a goal – killing off all ‘momentum’ with one big giant sucker punch.

    It was noticeable in the Richmond vs Carlton clash in round one, where Carlton dominated all night peppering Richmond with a barrage of inside 50s only to find themselves down by 11 of the final siren; or Gold Coast’s back-to-back goals following Collingwood’s 40-point comeback in round 18; or Brisbane’s inability to capitalise in the last 10 minutes of their round 13 clash against Adelaide. Currently, we can tell the story through a combination of territory, possession, inside 50s, expected scores. But there isn’t an all-encompassing metric that measures threat. That’s what I’ve attempted to do in this piece. 

    What is it? 

    Threat is derived from my previous expected threat model with elements of equity ratings. It aggregates the maximum probability of scoring a goal from each chain across a rolling (approximate) 5 minute window to determine which team had the more threatening chains. 

    How is it calculated? 

    The goal scoring probability is calculated using field position and possession states – set and general play – for every possession in a chain. It then derives the maximum goal scoring probability for the team that owns the chain. 

    Examples

    Takeaways:

    • Carlton was more threatening for large parts of the game
    • Richmond managed to score 7 goals in periods where Carlton was more threatening compared to Carlton’s 1 (which now allows us to understand how many goals teams score/concede against the run of play)

    Takeaways

    • This game was a lot more even with both teams scoring goals against the run of play
    • 3 of Adelaide’s last 5 goals came during periods when Brisbane had greater threat
    • The most dominant period of play came in the last 20 chains when Brisbane failed to capitalise 

    Next steps

    This is still somewhat of a work in progress and requires some further tweaking. Any feedback is welcome. 

    Next week I’ll detail which teams lead the league in scoring and conceding against the run of play. 

    P.S Please @ me if you’d like me to run the viz for any specific games from the season so far.


    Shark Week

    Emlyn Breese / CreditToDuBois.com

    There’s a lot still to chew through in the data behind last week’s ruck piece.

    Given that Shark Week starts this Sunday this topic seems only fitting.

    For those unaware, Champion Data gives a definition of a sharked hitout as “A hitout that directly results in an opponent’s possession.”

    [author’s note: I’ve had to infer sharks from the data I’ve got which probably results in some false positives. I’d expect my numbers to be a little higher volume and lower quality, but should still be broadly representative]

    So, who is Jaws to the AFL’s Amity Island?

    Jack Macrae has a clear lead feasting off opposing rucks, and the list overall isn’t too surprising – elite inside midfielders who are great at winning their own ball.

    On the other side of the ledger it’s Matt Flynn who’s chumming the water most regularly this year.

    If we expand it out to a team-wide scale we can find Adelaide has the worst differential in the league between sharking and being bait, which isn’t totally surprising as Reilly O’Brien gets sharked regularly.

    St Kilda being on top is somewhat surprising, while the Bulldogs at #2 are to be expected with the mids available to them.

    I’ve got data going back to 2017, so let’s see if there are any particular feeding frenzies. On top we’ve got Brisbane feasting on Adelaide to the tune of 26 sharks in their round 9 matchup last year.

    Finally, over that expanded timespan who of our sharks has a taste for a particular player?

    Have we built the AFL where the footy people are?

    Sean Lawson

    Despite the dramas around the Tasmanian team, another round of expansion talk was kicked off by media reports suggesting that the WAFC is starting to take the question of a third team in Western Australia seriously.

    TWIF’s own Joe Cordy also posed a question related to the expansion question, asking what a new AFL created with no history might look like:

    Logically, the best way to figure out where teams should be based would be to go where footy fans are. Fans are a nebulous thing to define The polling company Roy Morgan rather notoriously likes to publish survey data from a market research perspective showing Sydney and Brisbane with the largest fandoms in the league.

    But Roy Morgan wants to sell fan profiles to advertisers, and therefore privileges name recognition and extremely casual interest. A large majority of their profiled “fans” don’t attend games and a solid percentage don’t even watch on TV.

    We need a firmer basis for identifying where the football fans are than that, and luckily the Australian Sports Commission runs a large survey called Ausplay that collects information about sport participation. Playing footy is a pretty reasonable proxy for where the “footy people” are.

    Fairly obviously there is a preponderance of Victorians playing footy, about 40% of the national total, as well as a surprisingly tight spread across the other four mainland states. These numbers mean Victoria punches above its weight in national talent contributions, as over half the player pool are from Victoria.

    Correspondingly, NSW and Qld produce far fewer AFLM players than their footy player base would suggest, which is down to many historical and cultural factors.

    There is also a pronounced gender split in footy demographics by state, especially for adult women’s participation:

    Simply put, it appears that North of the Barassi line, footy is more of a women’s game while women’s participation lags in parts of the heartland.

    Converting the national participation shares to the ideal distribution of an 18 team league we get the following breakdown of teams in a fresh start:

    This is not too different from today’s setup. Victoria is over represented in the AFL, unsurprisingly, but still would warrant 7 teams in an evenly distributed competition.

    With 7 Victorian teams in our “fresh start” league, compared to the contemporary AFL the three “extra” teams would be allocated to Western Australia, New South Wales (more on that in a moment) and Tasmania.

    It should be said, against various arguments to rationalise the Victorian clubs, that the difference between 7 and 10 Victorian teams is probably not that substantial from a football finance perspective. Those three extra teams located near the big teams would be generating a lot of economies of scale, saving travel costs, and boosting overall attendance by bringing a lot of extra people through the gates as away fans at the many Victorian derbies which occur.

    But let’s get back to the question of expansion, and in particular, that suggested under-representation of NSW. This number looks odd on the face of it – New South Wales with the third most footballers of any state? And potentially warranting a third team, like footy powerhouse Western Australia?

    Barassi Line illustration, source ABC News

    As any student of footy should know, though, the unique thing about NSW in Australian football is that a lot of its football base is in the south and east of the state, rather than in Sydney. South of the Barassi Line, things get AFL focused.

    We can more or less quantify how much this matters to NSW footy numbers.

    Ausplay prior to 2023 had local government area participation estimates for Albury, Wagga Wagga and Bega which all placed Australian football participation at over 6%. Most other LGAs in NSW were too small to have data, or situated further north without footy participation breaking into the top 10 activities.

    If we extrapolate those Albury and Wagga participation rates out against the population of the southern NSW Riverina and Murray regions as a whole, we get probably about 16000 footballers in that region, more than in NT and not too far below the number in Tasmania.

    But then of course, there’s also a notable city of a half a million people sitting surrounded by southern NSW, with another roughly 12000 footballers.

    Surrounding Canberra is a region which, while not footy heartland, can be estimated using ACT participation rates to maybe have about 6000 footballers as well.

    Putting all that together, we can see that there’s a largely forgotten football region, with more footy people than the current new expansion location of Tasmania. It is a region centred between Albury, Wagga and Canberra, though also stretching a long way west.

    Adjusting our quotas to split NSW and combine the southern regions with the ACT, we can see that our third NSW quota reassigns fairly comfortably towards the Barassi Line:


    Around the Grounds