This Week In Football is a collection of some of the best in football currently outside the walls of AFL clubs or broadcasters. Each week a curated grab bag from regular contributors and special guests will provide insight into and beyond the game on subjects of their choosing. For more about our contributors, click here.
Got an idea or want to contribute? Email thisweekinaustralianfootball at gmail dot com
On Tuesday SEN’s Sam Edmund reported something that has been a long time coming – a crackdown on injury list reporting from clubs.
The AFL's email to club media departments today regarding injury lists and vague terminology. "Clubs are reminded that as part of the Media and Broadcast guidelines, injury updates need to provide fans and media with a clear understanding of injury return timeframes. Recently we…
“It is not permissible to provide general availability windows, ie. short term, medium term, long term,” the AFL confirmed in its 2024 policy.
So this week isn’t so much a new crackdown, but a crackdown on a crackdown.
TWIF also understands the perspective of clubs. Injury management is hard, and the expectations of those who rely upon injury reports for personal gain is sometimes unrealistic. But there also has to be some transparency in a league where there are meant to be guidelines and standards for almost anything imaginable. What may be a more palatable solution is some type of middle ground – one that doesn’t provide definite dates but instead windows of availability.
Mastering the dark arts of defending the control game
The Brisbane Lions won the 2024 premiership on the back of some of the best ball movement we’ve seen since the Clarkson-era Hawks. They sliced and diced through opposition zones with quick-release kicks —finding uncontested marks in tight spaces to suck in defenders and opening space for their dynamic forward line to exploit.
In what is typically a copycat league, you’d expect more clubs to adopt Brisbane’s blueprint in 2025. Yet, surprisingly, many teams appear to be zigging when we expect them to zag.
Consider the question: Are opposition defenses tightening the screws to nullify the strengths of the reigning premiers? Or is there a broad acknowledgment that Brisbane’s style is difficult to replicate without the right personnel?I lean toward the former—led by the likes of Collingwood, teams are beginning to master the dark arts of stalling opposition movement without conceding a 50m penalty. So much so, Brad Scott requested a please explain to the AFL umpiring department.
"It just seems there's been a bit of creep on the stand and the protected area."
If we revisit each team’s use of quick-release kicks in 2025, similar patterns emerge.
Quick-release kicks are defined as kicks to and from an uncontested mark occurring in under 3 seconds. Note: The available data is rounded to the nearest second and may lack precision depending on capture timing.
Most of last year’s leaders—Brisbane, St Kilda, Essendon, and Fremantle—have experienced a noticeable drop in their ability to find uncontested marks through quick-release kicks.
With a shift back towards chaos across the league this year – 54% compared to 44% in 2024 – the control brigade, led by Brisbane, will be hoping the umpiring department are listening.
Rucks have a lot of responsibilities in football, and arguably many of the most important ones happen outside of the ruck contest. Different players have different strengths – and the best rucks in our game are multitalented – but we decided to drill down into what some of these roles entail and who excels at them.
The numbers below are based on the 21 players who have appeared in at least four games this season, and attended more than 50% of ruck contests.
Defensive Ruckwork – Using height as a shield
There are a few ways in which rucks can defend. You may have heard recently some commentators talking about how well Darcy Cameron intercepts opposition possessions down the line, and though most of this is done in the front half, it is a key aspect of team defence.
There are currently seven rucks who average more than 2.5 intercepts a game, and only two who average more than two intercept marks. Darcy Cameron and Max Gawn leading the way with an average of 2.63 and 2.38 intercept marks respectively.
Another way rucks are able to assist with team defence is dropping back to help out with spoils and one percenters to help create stoppages where they can utilise their ruck craft.
Matt Flynn has averaged five spoils a game form his appearances for West Coast this year, while a total of eight rucks average more than two spoils a game.
Rucks as a Midfield Weapon – Using rucks as an on-baller
Modern rucks are notable much more agile and skilled than the rucks of yesteryear, and the best rucks are able to rack up as many disposals as some midfielders.
There is an old adage of “don’t handball to a ruckman,” but the game has evolved past that in many cases, and there are multiple rucks receiving upwards of five handball receives per game.
As well as racking up touches from handball receives – or more commonly marks – the more agile of our modern game’s giants are able to pick up the ball below their knees and create attacking possession chains for their teams.
As many as six rucks currently average 4.5 or more ground ball gets per game, and Brodie Grundy averages a whopping 3.25 post-clearance ground ball gets.
Attacking Through Rucks – Creating scores through ruckwork and possession
Which rucks contribute most to the score? Of our 21 nominal rucks, ten average 4.5 or more score involvements a game, some off their own boot, some goal assists, and some involvements in scoring chains.
While some rucks average more scores themselves, these ten are involved in the most scores for their teams.
Big Targets up Forward – Using Rucks as keys
While some rucks rest forward, some also drift forward after a contest to create an option – think the way Petracca or Heeney does, only a foot taller and significantly slower – with ten rucks taking a mark inside 50 at least every second week but only Sam Draper averaging better than a goal a game.
Where do they get their footy?
Looking at possession locations, we can see that the majority of rucks get their ball in the front half, with just the following nine players receiving more footy in the defensive half of the ground.
From the others – the majority of rucks who average 50% or more front half possessions – just four average 60% or higher front half possessions. This obviously makes sense with Jackson and Darcy sharing duties, but speaks to the team structure of Geelong and Brisbane that Stanley and McInerny spend so much time down there.
But what does it all add up to?
While all of these skills are individually valuable, the best rucks in the competition string multiple of these together to become more than just a hitout and mark player.
You will notice that the best rucks in the competition appear on multiple of these lists of roles and skillsets – players like Max Gawn, Rowan Marshall, Darcy Cameron and Tom De Koning – and this is what makes them so valuable in relation to their peers.
The days of the tap only ruck are well and truly behind us, and you have to be talented at much more than just ruck craft in order to be picked over a lesser ruck who outperforms you in other parts of the ground.
What might Dean Cox be adjusting?
Sean Lawson
In a radio interview this week, Sydney Swan Matt Roberts summed up the experience of a successor coach, noting the change that comes with a previously subordinate internal voice taking over as the primary voice.
Where previously Cox “had to listen to Horse” and couldn’t “put his full spin on it”, now he can be fully clear about his own preferences about how he wants the team to play.
Even without a new coach, one imagines that a big source of change for the Swans would be addressing the way they lost the grand final last year and were also soundly beaten on some other occasions. We can assume that changes this year pushed by the new coaching team are heavily driven by those experiences.
So after two months of football, against the backdrop of poorer performances, what can we glean about the changes Cox might be implementing?
First up, the Swans seem to be taking the game on more. No team has taken more running bounces per game in the last five years than Cox’s Swans, and they’re also gaining a bit more ground per disposal.
This may be a response to the way opponents sought to cut off Sydney’s transition game with a high defensive line and corridor density last year. If short kicking options are cut off, the running game can be a risky but rewarding alternative method of transition.
The run and bounce by Blakey, Bice, and Warner (all in the top 20 for most bounces) are most notable and visually striking, but Wicks, Florent, Roberts, Heeney and Campbell all chip in here with a variety of options. Most are also among Sydney’s preferred distributors, the better to put opponents in two minds.
Second, the defence is… changing.
Dean Cox has talked of a new defensive approach multiple times this year, and famously tried to move McCartin forward to cover injuries while leaving new players like Paton and Hamling to cover the gaps.
Watching live, there have been notable moments of confusion about handovers and trade-ups, despite many of the same personnel involved. This suggests changes in role assignments, a shift in philosophy about when to hand off, when to provide help, when to come up or sit deep, and so forth.
What we can say from the statistics is that this new approach, so far, seems to be resulting in more isolated defenders and more defensive contest losses. Sydney last year spoiled more than just about anyone, relative to the defensive load faced, they feasted off spilled ground ball in rebound, and they kept moments of defensive isolation to a minimum.
The Swans after two months with Cox at the helm, are facing more 1v1 contests per game, and losing more of those than in previous years. They’re also spoiling less, and although as Cody notes below, spoils are down across the league, Sydney have also slipped from having the most spoils to merely 4th most.
Last year, Sydney were notably vulnerable to possession and control games, most dramatically in the grand final when the Lions’ uncontested marking was off the charts. Clubs looked to deny the turnover game by keeping the ball away from them.
This year, Sydney appear to be making more of an effort to push up and apply pressure and deny that possession game. Opponents are marking the ball less often, and the average metres gained point to longer ball use and perhaps less shorter and more lateral options.
All of these things are very preliminary, and occurring in the context of significant midfield and forward line absences, and and unsettled defence, but they are elements to watch as Sydney tries to find their feet under the partial break with the past represented by their successor coach.
Where have the clunks gone?
Cody Atkinson
I got into a discussion yesterday.
On the internet.
So not a discussion but more a character limited amalgam of words, ideas and preconceived notions. Not an argument either, although the internet is good for them – and the line is often fine between fight and discussion.
When researching some items around ball movement, something glaring stood out.
A lack of clunks. What happened to the big men, and their ability to fly and take big grabs?
It’s still early days this season, but the 8.8 taken per team per game this year would be the lowest in the era we have records for. It was 9.6 last year – which doesn’t seem like a huge drop, but it’s been as high as 11.5 per game in the last five years. That’s almost two a quarter across both teams.
The first reaction is to look at whether it’s an attacking strategy symptom – going for more open targets down the ground – or a defensive improvement. All up, there’s a slight downtick in the number of overall marks, but nothing dramatic that would indicate a massive course correction.
Looking at the number of spoils, we have some indications that it might not be a pure – or traditional – defensive cause either.
This season has also seen the fewest spoils per game of any season since 2012. There’s about seven fewer spoils per team per game than in 2019. That’s 14 per game across both teams, or nearly four a quarter.
If you take the spoils and contested marks together there are twenty fewer contests than in 2019, or 20% fewer.
Kicks are down in that time period as well, but only about 5%. Total marks are down about 5% too – which makes sense. That’s proportionate.
The easiest conclusion is that in the past few years there has been an emphasis towards teams finding open short and intermediate targets at the expense of bombing the ball long to packs. Football is a battle between position and possession, and the former may be taking precedence over the latter. This has happened before – note the massive rise between 2005 and 2010 in that first graphic. It could be a sign that the tide might be turning leaguewide, as James alludes to above.
There could also be some personnel issues. There’s been a number of noted contested markers missing time this year, from Sam Darcy to Jesse Hogan and Harry McKay. As availability shifts for the league this number may rise.
But it is worth tracking over the coming weeks. Keep a look out for the clunks and the fists.
Around the grounds
Here’s some more stuff that isn’t from here but is good to take in about footy
This Week In Football is a collection of some of the best in football currently outside the walls of AFL clubs or broadcasters. Each week a curated grab bag from regular contributors and special guests will provide insight into and beyond the game on subjects of their choosing. For more about our contributors, click here.
Got an idea or want to contribute? Email thisweekinaustralianfootball at gmail dot com
We’re not quite a third of the way through the season, winter is starting to make itself felt, and footy is starting to become a routine grind after the flashy baubles of the early season fixture.
Conventional wisdom would say that this is a good time to take stock of the ladder and how it’s starting to take shape.
Plenty of pundits like to whip out hot takes that only handful of teams can win the flag. Some have already shouted that the season is over for teams – such as Sydney – just because they have a negative win loss record two months into the year.
However at this stage of the year there are a lot of caveats that need to be considered. Firstly, there are some real sample size issues. Teams have also played against very different opponent sets.
It’s still early, and things change. Some of the hottest teams have not yet faced the full weight of opposition analysis finding counters and exploiting their weaknesses. Other teams are starting to work on emergent flaws in their game. Some teams are starting to rally and settle, others maybe falling apart after early friskiness.
Work undertaken by Max Barry’s Squiggle power rankings shows us a more nuanced picture.
This paints a picture not too different to expectations at the start of the year. There’s a large group of 12 teams not too far apart from each other, separated as much by injury fortunes, close game luck, tactical quirks and scheduling as anything else.
Then, the universally expected three rebuilding stragglers at the bottom, and a group emerging who are struggling to keep pace – perhaps most surprisingly, including Melbourne.
The ladder doesn’t exactly lie, even at this relatively early stage. But it can do with some extra context.
Not long ago on Twitter, I shared a strange little story from the margins of AFL history -a forgotten era, and a tale of a missing name.
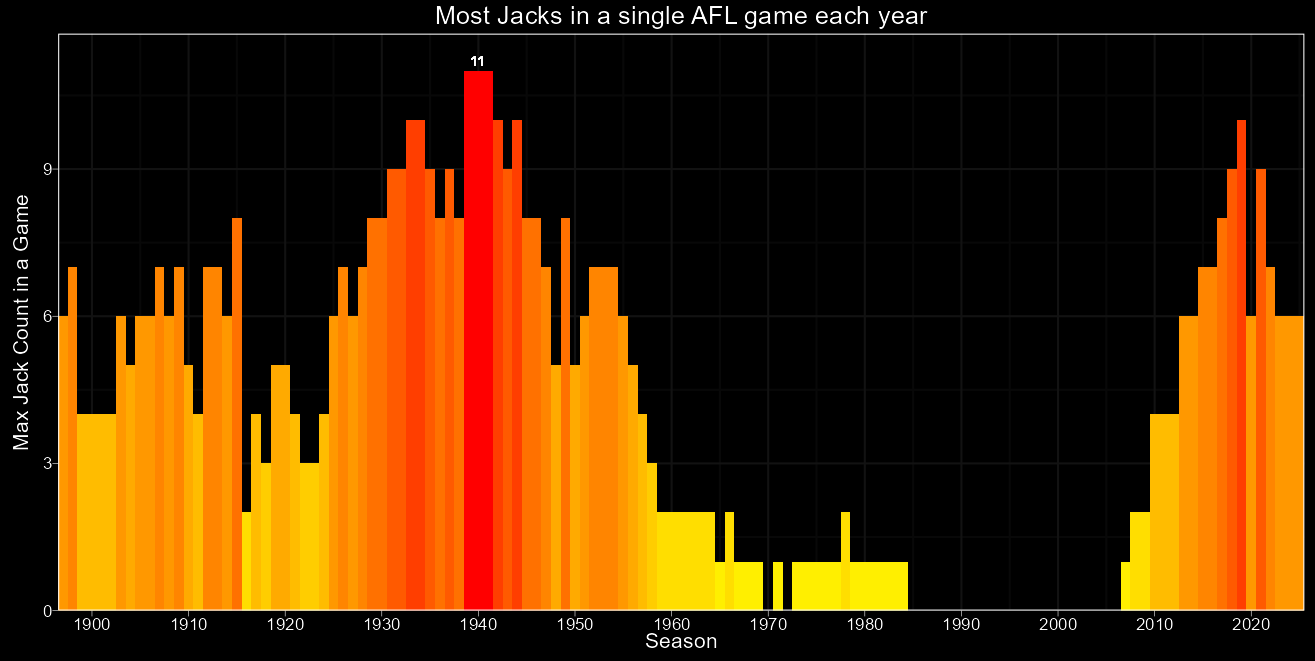
Between 1965 and 2005, the AFL went through a major Jack shortage, a period that I now call The Jackless Era – a staggering 40-year stretch where the name Jack all but disappeared from the league.
It’s especially odd when you consider just how central Jacks once were to the game. Think Dyer. Titus, Clarke, Hawkins. These weren’t fringe players, Jacks were champions of the game. Then, suddenly, they vanished.
This wasn’t just a blip. It was a full-blown drought – a naming recession that stretched across generations. And while the game kept evolving, Jacks stayed behind.
At the peak, from 1939 to 1941, the AFL saw three consecutive years where 11 players named Jack – a full 25% of the field – took to the ground in a single game.
But sometime in the early 2000s, something shifted.
Demographer Mark McCrindle suggests Australians tend to bring names back from the past and have a preference to go for colloquial, down-to-earth names.
There could also be a generational skipping effect, where recent children are named after a grandparent or great grandparent.
Data suggests AFL names rolling in trend with US babies, albeit with a slight lag.
And one can’t help but see a role of the titular 1997 Oscar winning motion picture Titanic, with the heartthrob Jack Dawson playing a role.
Whatever the reason, Jack was back in cribs – and soon after, back in clubrooms.
By the mid 2010s, the Jack Renaissance had well and truly begun, and it has had non-insignificant impacts to win-rates.
Historically, of the 6,986 games of AFL played with a ‘Jack Differential’ (one team having more Jacks than the other), the more Jack-endowed team has won 50.4% of the time.
A basic regression suggests that each additional Jack your team has over the opponent increases your chance of winning by ~0.14%.
Now, the AFL is once again full of Jacks. St Kilda notably leading the charge. Jacks are to St Kilda as to lengthy headbanded blonde hair is to Geelong.
We even saw the greatest ‘Jack Off’ in the modern era occuring in Round 1, 2019 where St Kilda (6 Jacks) defeated Gold Coast (4 Jacks).
But not every club has embraced the return.
In fact, one club now holds a rather unwanted record: Essendon. The Bombers haven’t fielded a single Jack since 1980. That’s 45 years without a Jack – the longest current Jack-less streak.
It’s a curiosity. A coincidence? Maybe. But given their finals drought it might be starting to feel like a curse. Could a deliberate Jack recruitment strategy be the key to breaking Essendon’s drought?
Only time will tell. But for now, one thing’s for sure.
The Jacks are back and Essendon is on the clock.
Reports of the death of tackling have been greatly exaggerated
It’s that wonderful time of year again. After 130 years of V/AFL football the tackle is dead, and with it goes the game we love.
You can’t even lay a good hard tackle anymore without being suspended, so how on earth are these players supposed to play the game – or so a handful of pundits (and North Melbourne players) would have you believe.
Or is this all a little bit much? Is the tackle really dead?
If I asked you what percentage of tackles this year had been deemed dangerous enough to warrant a penalty, what would you guess? What if I asked you what percentage had been deemed dangerous enough to warrant a suspension?
Would you guess 5%?
Maybe a little more conservative and guess 1%?
Well, we painstakingly went through all of the rough conduct reports from the start of 2024 to find which ones were dangerous tackles, and either of those guesses would be way off.
Just 0.1% of tackles have been cited this year – the same as it was for the whole of 2024. And of those 33,000 tackles since the beginning of 2024 just 0.04% have resulted in a suspension.
That’s around one in every two and a half thousand tackles.
Is it true that the matrix could take more things into consideration? Sure, but with the knowledge we now have around concussions, when tackling you have a duty of care to your opponent.
Tom Atkins has placed a record pace 76 tackles so far this season without having been cited once. Last year H&A leader Matt Rowell and overall leader James Rowbottom both went the whole season without so much as a fine. So it certainly is possible.
*Data taken from available footage of rough conduct charges on MRO reports and checking match video for incidents
Approximately halfway through the last quarter of Saturday’s clash between the Lions and Saints, Zac Bailey slotted his 3rd goal of the day to extend the lead to over six goals. If there was the faintest sliver of hope for a comeback up to this moment, it had just been extinguished.
It left everybody in the ground with the question of what they do with the last remaining ten minutes of play.
For Jonathan Brown and Dermott Brereton the answer from the Brisbane perspective was obvious: put the foot down.
They were clearly the better team on the day, and now they had an opponent with nothing left to play for. It was obvious to both commentators that they should boost their percentage, as about half of the top eight places would come down to a tiebreaker from teams on equal premiership points.
Instead of piling on the score, though, the Lions largely just saw the game out. They stopped chasing or applying as much pressure as they had been. The Lions put on another three goals but let another three through.
This allowed St Kilda their highest quarter score of the night, and the margin ended up in much the same place as when Bailey put the game to bed.
This decision to preserve energy isn’t unique to Chris Fagan. Last weekend also saw:
After completing a streak of twelve unanswered goals, Gold Coast brought key players to the bench and conceded their first major in nearly an hour against Sydney.
Following their dominant third quarter the Bulldogs gave their captain and current best player in the game the last term off.
Most conspicuous was Melbourne’s decision to rest their captain and allow Richmond to score the last four goals of the game.
None of these decisions put the potential result of the game into question, but they all cost their team an opportunity to increase their percentage.
It’s likely they’d made the same observation of a trend around percentage: it’s exceedingly rare for percentage to come into play, and even rarer for it to have any consequences.
Of the 234 ladder positions decided in the 18-team era, 71 belonged to teams who had fallen behind another on percentage. Of those 71, only 20 made a difference in September.
Broken down further, the most common consequence is missing a home final in the first week (i.e., teams finishing 3rd, 4th, 7th or 8th on the same number of points as 1st, 2nd, 5th or 6th). Only four teams in the last 13 seasons have realised the nightmare scenario of missing finals completely because of their inability to run up the score on their day, or play out the four quarters on their opponent’s.
When put side by side a clear trend can be seen in the variability between where percentage will put a team on the ladder:
…and where collecting premiership points will put you:
With the introduction of the Opening Round, Gather Round, and the pre-finals bye, men’s seasons are longer than ever measured both by games played and the days between the first and last bounce. Players are also expected to cover more distance at higher speed, with less opportunities for a spell on the bench.
For teams aiming to go deep into September, they now need to not only manage the games they’re in, but the weeks and months ahead as well.
While you may see coaches flip magnets around, even so egregiously that their counterparts take exception to it, we’re unlikely to see teams breaking any scoring records in the near future.
It seems we’re in marquee season right now. We’ve got the Q-Clash and the Sydney Derby coming up this week, and across the last two weeks we had the Easter and ANZAC matches.
What better time to rile everyone up by ranking the various marquee fixtures across the league.
I’ve detailed my methodology over at CreditToDuBois if you want to have a look, but I’ll present the end results here.
In brief, I’ve ranked each clash across the last 10 instances across criteria of competitiveness (50%), investment from fans (25%) and investment from players (25%) to come up with a completely objective and scientifically rigorous order.
The methodology linked above goes into far more detail about how I reached these rankings, but this gives a quick overview of how the different components contributed.
What it’s like doing a post-match press conference
Full disclosure: I’ve collaborated with Gemma in the past and she’s one of the best minds in football media going IMO.
I’ve been paid to go to the football for several years now, including getting the opportunity to learn from coaches. Given the discussions of the week, I thought it would be worthwhile to talk about how at least one journalist sees the process.
The game after the game
After the siren blows the next phase of a football game begins. If football is the action, the post game is the reaction.
Fans tend to look for either the exits from the ground or the way onto the field for kick to kick. The players eventually float towards the rooms to get a brief debrief before cooling down in front of the inner circle, friends and family.
Staff and security start to pack down and secure the venue, turning the haven of activity into a ghost town once again.
A small handful of individuals head the other way, into a typically dark hidden room in the bowels of the grandstands.
Post-match action deep under the SCG grandstands
The results are typically broadcasted live across the nation and uploaded to youtube shortly after.
This is what happens at an AFL post-game media conference.
Before it begins journalists tend to work up their questions. Sean and I tend to dial up our data and look if it matches with trends we’ve observed across the game. We also try to weave any questions interested onlookers have fed us through the match.
Setting up before the cameras roll
The sound and camera guys have to set the room up beforehand, with one inevitably playing the role of coach. Journalists that are kicking around often help set the room up at smaller grounds.
The board room at Manuka doubles as the press conference room.
Different journalists have different motivations at these events. Most are there for filing match reports or instant analysis for quick consumption. Very occasionally you’ll see someone from the host broadcaster down to dominate the early proceedings – a practice that seems to have stopped in recent years. There’s a few that are looking to fill out articles about broader topics of the day – think reaction to tackles or the like.
Even rarer still are journalists who are looking at deeper issues or trying to fill insights for other articles. That’s where Sean and I usually fall.
That means generally you’ll see three different types of questions:
Surface level on the who, what, where of a game, including injury concerns.
“Gotcha” questions trying to get a quote to base a “topic of the day” article on.
More strategic, deeper questions on how footy is played in 2025 and the roles of different players.
Coaches also have different motivations in these press conferences. They realise that, due to the potential audience, they have some responsibility to provide an explanation for what we have just seen.
For losing coaches, there’s always a natural undertone of disappointment and anger. Winning coaches are almost always happier.
When the cameras are on.
Pre conference preparations
It’s important to note that the behaviours of both coaches and journalists tend to shift before cameras are turned on and once they are turned off. There’s joking, light tomfoolery and the like. It’s a workplace, after all.
Speaking their language
As someone who tends to ask the more strategic questions, it often takes time to signal to coaches the line I want to take. As it differs from the usual line of questioning, making sure that language and terminology that Sean and I use is correct is critical.
I got it embarrassingly wrong once with Sam Mitchell, using lingo from another club to try to talk about the Hawks’ choices.
The one thing I’ve learned from doing it for the last few years is just how willing coaches are to just talk about how footy is played (within reason). Once they know they can talk about spares, stoppage, swinging the ball and spreads, they are extremely willing to elaborate. They – like most reading this – are footy nuffs or nerds.
I’ve also talked to Ross Lyon, who gave me a similar “grilling” when we started asking questions. Like last week’s press conference, the Saints had just lost a game. I was relatively prepared, and able to swing it back where I wanted to go (including getting a couple of quotes I needed for upcoming pieces) but there was a moment of uncertainty at the start. It felt like a battle, but a fun one.
I understand Ross may have enjoyed it too, especially as we started to get into the nitty gritty more.
But my motivations were pretty different to most journos, and certainly to the role that Gemma would have played at the presser. It’s an odd task – asking about how someone just publicly lost.
In my reading that press conference would have been far better if Ross engaged with the questions straight up, and given Gemma the chance to ask follow ups (or lead her there). But I also didn’t lose by 45 points in front of an audience of hundreds of thousands of people.
Overall, some see the process as a waste but I strongly disagree. I’m very biased though.
The best kicks: Are the most threatening and the safest kicks the same players?
Sean Lawson
Last week Liam showed off his updated alternative to the AFL’s kicking efficiency stat, where two values, kicking threat and kicking retention, show how damaging players are compared to the average for their kicking context, and how well they retain the ball. This got me thinking about to what extent these two types of “good kicking” come from the same players.
The top quartile of most frequent kicks (currently having at least 67 kicks so far this year) are spread across all points of the spectrum, but it’s relatively rare for high volume kickers to be equally very strong on both score threat and ball retention. This stands to reason – it requires a player to produce scores from their kicks at a rate elevated from usual for their position, and also to have kicks that don’t get turned over as often as typical. Balancing safety and threat is hard, since intuitively players generally need to take risks to lead to scoring, but those risks also raise turnover potential.
Pat Lipinski, a key linking component of Collingwood’s ladder leading play, currently sits at the top in terms of combined threat and retention rating, with other standouts including the all-rounder Isaac Heeney, and Dylan Moore and Isaac Cumming, both also members of very effective offensive midfield/forward setups.
At the other end of the scale, perhaps fairly emblematic of Melbourne’s issues with the ball, Christian Petracca is using it much less threateningly and with more turnovers than would be expected from where and how he’s operating. He’s never been a high retention player but his threat rating is through the floor in 2025.
Three other things we can observe looking at the quartile of players who kick the most are:
A bit over a third of high-volume kickers are both threat and retention positive, what we might consider to be the all round effective kickers.
Most are better than average on at least one side of the ledger. Only a quarter of the 100 most frequent kickers were negative for both threat and retention
Safe but less threatening kickers are more common than the reverse.
This all tends to suggest that despite the clear difference between kicking to avoid turnovers, and kicking to produce scoring opportunities, the two skills aren’t entirely separate from each other.
Around the Grounds
Here’s some more stuff that isn’t from here but is good to take in about footy
This Week In Football is a collection of some of the best in football currently outside the walls of AFL clubs or broadcasters. Each week a curated grab bag from regular contributors and special guests will provide insight into and beyond the game on subjects of their choosing. For more about our contributors, click here.
Got an idea or want to contribute? Email thisweekinaustralianfootball at gmail dot com
This weekend in football tends to get dominated by one topic in particular – war.
The round containing ANZAC Day tends to feature more attention to the intersection of war and football than all other weeks combined.
There are some real connections between the game we love and the fighting we hate. Hundreds of footballers – amateur and professional alike – have served in wars over the years. Some of the game’s greats have arrived in Australia displaced from war-torn regions (either directly or via their families).
That includes footballers lost to the horrors of war. According to AFL records, 155 V/AFL footballers have died on the battlefields. Two of those men died in the Boer War, 94 in World War I and 59 in World War II.
So before you get hooked on the emotion this weekend, just remember football is a game, and war is horrific.
This Week In Football we have:
Matthew Nicks’ Plan B
Joe Cordy
Every year since the top-eight finals system was introduced, at least two teams have made finals that weren’t there the year before. Recently, it’s been a common sight to see a team slingshot from outside the eight into a double chance. Adelaide have established themselves as one of the favourites to complete this maneuver and play their first finals games of the Matthew Nicks era.
The composition of the Crows list during Nicks’ tenure has never leant itself to defence, and they’ve hovered as an average to below average defensive side since 2020. To compensate for this they’ve leant heavily on outpacing their opponents in attack: Nicks’ Crows invite the opposition onto them, waiting to intercept the ball and play on the counter, getting it to their talls in isolation like a Sean Dyche Burnley team.
This tactic has made them both the most damaging team in attacking from turnover, as well as the most improved team from 2024.
The Crows are #2 in intercept possessions, #1 in points from turnovers, #3 in marks inside 50, #1 in points from the defensive half, and are one of only four teams to average more points from chains beginning in their defensive half than their forward half.
This deep-sitting, counter-attacking style of course has the obvious issue of always allowing the opposition plenty of looks at their own goal. At the end of Round 5 they were conceding 48.0 points from forward half chains (4th highest in the league), and their Round 2 victory against Essendon was just the third time in the last 10 years that a team has managed to record a 10-goal victory while conceding at least 100 points.
After a 3-0 start they hit successive road bumps against fellow top-four aspirants: a controversial 1-point loss to Gold Coast, and a blown lead to Geelong. The cracks in Nicks’ gameplan were showing across these two games, as they allowed 18 shots from front half chains in each match for 58 and 63 points respectively.
Chris Scott identified in the post-match presser that his plan to nullify the superior firepower Adelaide have in the forward line was to turn the game into a shootout, exposing Adelaide’s backline and levelling the talent gap up forward through sheer number of opportunities.
Even with their spearhead Jesse Hogan missing, the GWS game threatened on paper to be a similar affair. The two teams came into the game as 1st and 2nd for points scored from the back half, putting similar emphasis on rebounding attack but with GWS showing more defensive grit. Instead living up to its potential on-paper of a high-scoring end to end affair the Crows came in with a gameplan to completely shut the game down.
The two sides combined for a score of 11.20.86, a total that wouldn’t have been enough to beat Adelaide in any of their first five games this year. Even though the total score of 34 was assisted by the Giants inability to put it through the big sticks, the underlying metrics such as only allowing 15 shots (nearly half of the Giants per game average coming into the round) and handedly winning post-clearance contested possessions 97-83 paint a picture of a team that was able to find a totally different path to victory to what they’d previously been using.
Instead of getting brought into another basketball game, they slowed the pace down, clogged up their opponent’s opportunities even as it cost them their own, and turned the game into a slog.
It may have been ugly to watch, but it showed a tactical adaptability typical of top-end teams. In a week where other ladder climbing aspirants like St Kilda had their front-half stoppage game picked apart, and Gold Coast’s transition game was stopped by a roof, it was a good time to avoid headlines.
Sometimes instead of digging your heels in and declaring “it’s who we are, mate” it’s better to find the most effective way to four points.
Everyone who grew up playing enough football has that one player that they believe with all their heart could have torn apart the big stage if only they had applied themselves.
I have multiple. Some had kids young and decided not to nominate for the draft (a decision that still makes no sense to me to this day), others who were approached by AFL clubs when we did our School footy 16s Melbourne trip but decided that the footballing life wasn’t for them.
And then there’s Dayle Garlett.
Dayle is the single most naturally gifted footballer and athlete I have ever played with or against. Which is fair praise, as I played junior football with names like Nathan Broad (who I also played a lot of one-sided backyard cricket against), and Murray Newman, and against the likes of Stephen Coniglio, Rory Lobb and Charlie Cameron.
He was the type of player who could tear you apart in minutes, all the while barely looking like he was even trying. He could outpace the average player gracefully, could kick the ball 50 meters with both feet, and had the arrogance to make it all work confidently.
Garlett wasn’t selected in the 2011 AFL draft, mostly due to the already evident behavioural issues. He wasn’t welcome on the aforementioned Melbourne trip – despite being listed as an underager in the Under 18s All-Australian squad that same year. He was also selected for All-Australian honours again a year later, but once more was overlooked in the draft.
In the 2013 AFL draft, finally an AFL team was ready to take a risk on this clearly elite talent, and Hawthorn took him as a 19-year-old at Pick 38 and their second pick overall. He spent the pre-season living with then-captain Luke Hodge, but already signs were there that he was going to be unable realise his full potential.
After a few months of late appearances and missed training sessions – despite reports his professionalism was on the improve – Garlett was given permission to return home to Perth to obtain his drivers’ licence.
Just one day after Luke Hodge assured the media that there was nothing more to see here, Garlett told Hawthorn that he was quitting football shortly after landing in Western Australia.
“Unfortunately this situation hasn’t worked out as the club or Dayle would have hoped, and while we’re disappointed we understand his decision. Despite the club’s efforts over the past six months to help him adjust to an elite lifestyle, Dayle has found the regimented systems and standards of a professional club challenging,”
We acknowledge that Hawthorn Football Club places high expectations on all of its players, but it is equally supportive in working with each player to help them meet our standards and behaviours if they are committed to doing so.”
Later it was learned that his feelings of isolation had reportedly led to erratic and spontaneous behaviour, resulting in Garlett getting mixed up with criminals in Melbourne’s drug industry, leading to a habit he was unable to shake on his return home.
In late September 2015 – just weeks before his former teammates celebrated a third consecutive premiership – Garlett was charged with a series of theft and driving-related charges dating back to just weeks after his return to WA, and sentenced to five years in prison.
As is sadly the case with many who end up in the system and mixed up with the wrong people at such a young age, he has consistently reoffended since then, spending most of the last decade in and out of prison.
Shortly after his first sentencing, his lawyer requested a suspended sentence for Garlett, stating that the jail term was “manifestly excessive” and would be “crushing,” arguing that there was only a “small window of opportunity” for his client, whom he said had “a very promising career prospect”.
“He is worth another chance and he’s a good bet to succeed,” Mr Giudice said.
Now a man who has spent the vast majority of his adult life in prison, Dayle was once a prodigiously talented teenager who was charged with – amongst his more serious offences – stealing a pair of trousers to wear to court because he said he “wanted to show respect for the magistrate”.
When I think about Dayle now, I feel only sadness. Mostly for him, but also for his mum and his stepfather, who from all of my interactions with them seemed to be truly lovely people. It was his mum who once suggested the interesting strategy of getting me to tag Dayle’s tagger. He was such a good player that despite putting one of our worst players (me) in the midfield, it worked.
I think that as much as Dayle’s is a cautionary tale, it is one of how we could be doing so much more for our troubled young people – both as a sport and as a society.
Compassion and care is often an afterthought when publicly discussing the fates of teenagers and young adults. This doesn’t condone the behaviour, but such attention may not do much to rehabilitate the individual or improve the safety of society. It is important to remember that – while public figures – these players are just people who are figuring out who they are and their place in the world.
The near-constant media harassment of players who take time away from the game or who have minor slip-ups in the public eye (like almost any twenty-something) does nothing to improve the quality of the game we love, nor make it any more attractive to the talent it wishes to attract.
Based on data for the first six rounds of the season, quarters were lasting more than 32 minutes each, meaning the average AFL match took almost 130 minutes to complete.
I won’t go back over the entire article – including his exploration of some of the potential reasons as to why games are longer than ever before – but my eye was drawn to one particular section.
The part in question related to a social media post made by Geelong skipper (and then AFL Players Association president) Patrick Dangerfield earlier this year.
As audiences attention span reduces the debate will continue with the AFL quarter lengths. It’s Time to reduce them. – cue outrage 🤬 https://t.co/hT8KSF5nb3
I found the timing of Spits’ story and the reference to Dangerfield’s social media post interesting, as less than a week before the story was published Geelong had taken full advantage of longer quarters in their Gather Round clash with Adelaide.
This series of events got me thinking about which teams benefited most from longer quarters this year – by scoring more heavily in “time on” compared to the “actual” quarter (the first 20 minutes).
Geelong have registered 54.42.366 in regular time and 33.25.233 in extra time, which translates to 37.9% of their points scored beyond the 20-minute mark. This ranks them sixth, behind Carlton, Hawthorn, Richmond, Port Adelaide, and Brisbane.
However, scoring points is only half the battle. Having a high-powered offense in the dying stages of a quarter may mean little if your defence leaks like a sieve. This is where looking at the net difference in points scored versus points conceded comes into play.
Credit to James Ives for the chart inspo
Hawthorn and Carlton remain the top two teams (albeit the positions have switched) in terms of dominating scoring during time on. The Hawks score 44.5% of their points and allow their opponents to score 31.1% of their total during time on (+13.4%), defending slightly better than Carlton (47.3% versus 36.1% for their opponents, +11.2%).
Similarly, Essendon and the Western Bulldogs find themselves at the bottom end of the scale, conceding a greater proportion of scores in time on compared to what they can put forward themselves.
And while St Kilda are slightly below league average in terms of the proportion of points scored during time on (35.6%), they are ranked third in the above chart due to their impressive ability to not concede scores during the same period. To this point in the season the Saints have allowed opponents to register 27.5% of their score in time on – clearly the lowest in the league.
It will be interesting to track the breakdown of when teams score over the rest of the season, as a series of poor performances late in quarters could be the difference between playing finals or starting the off-season early.
Just a snapshot from me this week, but one I intend to build on as the season goes.
Reading through James’ analysis of Melbourne’s forward entries last week put F50 marking opportunities even more front of mind for me than it has been for the last few years.
To paraphrase Scott Steiner (and more recently his nephew Bronn Breaker), they say all marks are created equal, but you look at Melbourne, and you look at Gold Coast, and you can see that statement is not true.
A noticeable element of Melbourne’s forward line for a long time has been when they do generate marks inside 50, it often seems to be from lateral leads deep into the pockets generating low quality shots.
A quick look at WheeloRatings.com seems to back this casual observation up – they have been bottom 2 for the average xScore from set shots every year back to 2021.
To enable some quick analysis we’re going to define a “hot zone” – within 40m of goal and at no greater than a 30 degree angle from either goal post. Any time you draw a line it will cause some arbitrary inclusions and exclusions, but to me this seems like a pretty solid feel of what a really high quality opportunity looks like.
I’ll also break down the marks in those zones into three categories – Contested, Marks On Lead, and Uncontested.
Here’s how teams in 2025 are performing generating marks in the zone.
Unsurprisingly, Melbourne are dead last for marks in the most valuable area, and with a particularly bad return from contested marks. This is despite them generating the most offensive 1 on 1 contests in the league (16.3 per match, Carlton being the next on 13.2) and tracking at just below league average win rate for those contests.
It’s also worth looking at how teams are conceding marks in the zone.
West Coast and Melbourne being bottom 4 on both tables really illustrates some of the problems they’re having. West Coast are off the charts on conceding high value uncontested marks, which probably speaks to the kind of entries their midfielders and forwards are allowing opponents to set up through lack of pressure. I was somewhat surprised to see North with a relatively modest return here – not good by any stretch, but not catastrophic.
To finish up we’ll combine the two tables for a net differential which again shows Melbourne and West Coast as two laggards. The numbers don’t lie, and so far they’ve spelt disaster for both teams.
I’m Leo DiCaprio, he’s Joseph Gordon-Levitt, and this Wednesday night it’s footy from every angle but the ones that matter*
Ryan Buckland
I watched today’s Adam Yze pre-game press conference so you don’t have to.
Yze generously, earnestly, and very strongly, answered questions which all had something to do with Noah Balta for the first half of the session.
Questions which included:
Question: “The $45,000 paid to the victim, was that paid by the club or by Noah?”
Yze’s paraphrased answer: What a strange thing to ask, I can’t comment on that anyway.
My paraphrased thoughts [lol, c’mon man].
Question: “Are you personally comfortable with how the club has handled [the situation]?”
Paraphrased answer: Really? Yes
My paraphrased thoughts [lol, c’mon man].
Question: “Is he locked in from Round 16 onwards?”
Paraphrased answer: We’re worried about Round 7
My paraphrased thoughts [lol, c’mon man].
It was revealed later that there was a moment scrubbed from the Tigers’ official release of the media conference where Yze and a Tigers staffer told the pack there would be no more questions answered about Balta.
Hardwick fires back, and Hinkley on Wines' health.
“Come and field all the questions, in the suit… let them punch out, then bring the coach in… that’s what should have happened today,” said erstwhile host Gerard Whately.
“You can’t naively front up, you choose who the spokesperson for the club is, they chose the coach. You can’t then complain that the questions of the news media are about the story of the day.”
A lot of words were spoken in performative outrage, all to chasten a club for not being a willing participant in the manufacture of some soundbites to lead a 6pm news bulletin.
Gerard Whateley spends at least 30 seconds more or less laying out what he thinks shouldhave happened. He does this by playing out what predictably would have happened: bunch of questions about process, decision-making, reaction, hindsight, what happens next, answers given, footage gets clipped up and sprayed out later that evening.
Nothing which happens in that version of reality is different to what actually transpired; the difference is it’s some guy in a suit rather than Yze in the clips.
It’s 2025 football media writ large. A particularly vapid and pointless form of Inception where a broadcast partner spends time on its flagship panel show moralising are about how a club managed a weekly press conference.
Shit. Does that mean this missive is the Hotel, or the Snowy Mountain Hospital? I’m not in Limbo am I?
Actually, that would help explain the bleak, soulless, depressing state of ~football~ from Sunday evening to Thursday afternoon.
Essendon ranks 17th in D50 to score and 18th for scores from kick ins – highlighting their challenges in transitioning the ball from the back half.
On the other hand, Collingwood ranks 1st in % of intercepts generated i50 – indicating that much of this game will be determined by Collingwood’s ability to win and own territory vs Essendon’s ability to transition from deep in their own half.
Looking at Essendon’s kick ins, their profile appears much more diverse than the competition leaders, Hawthorn.
Which raises the question, is it better to be selective and pick your spots or take territory with predictability?
Against the best front half teams, it might be the latter. Let’s see if Essendon modify their approach on Friday.
Kicking efficiency is dead! Long live kick retention ratings!
No longer are we bound by the archaic and poorly designed metric of kicking efficiency. Long ago, a line was chosen at 40 metres. This serves as the core of the definition of an effective kick.
A 39m kick to a contest is judged “ineffective”. A 41m kick to a contest is judged “effective”. Surely there’s a better way to judge Australian Football’s most fundamental act. Kicking efficiency served its purpose, and now it’s time to move on.
Kick Threat and Retention Ratings was first created by myself in 2023 as a way to more accurately judge a player’s kicking abilities. This project has now graduated and is now publicly available for all to see on Andrew Whelan’s fantastic site Wheelo Ratings.
What goes into these ratings? There are two main outputs to generate ratings across around 320,000 kicks over the last five AFL seasons:
Retention Outputs: “Retention” is split into three groups: “Retain”, “Contest” and “Turnover”.
Retain looks if the player’s teammates get first possession (or acts first) after their kick. Contest finds if the next action is a spoil or a stoppage. Turnover is similar to retain, except the opposition gets first use or possession after the kick.
Threat Outputs: “Threat” looks at whether the kick generates a shot at goal later in that possession chain or not. As a guide, roughly 23% of chains result in a scoring opportunity.
Those two outputs are classified using location, angle, context and distance:
Kick location: this is measured by a x-y coordinate of where the kick took place. Shots at goal have been excluded since I consider goal kicking a completely separate skill to field kicking. There’s already a great metric for shooting performance called xScore.
Context: This looks at how the player received the ball.This acts as a proxy for implied pressure on the kick. Context is split into three types: Contested, Uncontested and Set. Contested is a grouping for all loose and hard ball gets, crumbs, and gathers from hitouts. Uncontested contains all handball receives, gathers, bounces and advantage frees. These all imply a level of control from the ball carrier, compared to a contested possession. The last group is Set, which includes all marks, and kick-ins and free kicks. This group implies there is no pressure on the disposal.
Angle: Angle is a continuous variable from -180 to 180 degrees. For the statistically inclined, this is the arctangent of the kick start and next action (i.e. a mark) location. This captures the angle from the kick location relative to the parallel direction forward.
Kick Length: This groups kick distance into two categories – short and long. The end location of kicks is difficult to precisely determine due to dataset limitations. I’ve chosen to take the kick intention of short v long rather than the actual distance. This group is split at the 32m mark, which is the midpoint of the two distance peaks.
The next table looks at base rates of each of these groups. Also included is a “defensive” or “offensive” half identifier for kicks that were taken in the each half of the field.
Here’s a more plain language explainer.
A player who kicks the ball short and backwards from a set play in their defensive half should expect to retain the ball 98% of the time.
This is considered the easiest kick in football, and a player that hit their target 98/100, with the other two going to a contest/turnover. As a result the player would finish with a retention rating of 0, and gain no benefit from exclusively taking easy kicks.
However, they would have nearly 100% Kicking Efficiency! Wow what an amazing player! Alas, they have kicked at the AFL average for that situation.
A player that kicks straight and long from a contested possession in the forward half is expected to hit their target 32% of the time. If they hit their target more often, they would be kicking above AFL average and would receive a positive kick rating. Hitting tougher kicks more often does more to boost your retention rating.
The crux of this model and analysis is that it takes into account the situation in which the disposal took place. These contextual pieces give us a broader understanding of kicking effectiveness, divorced from an arbitrary line from the early 2000’s.
These features are then modelled using an XGBoost classifier to generate expected retention and threat rates for every kick in the AFL. From here, we can generate ratings and find out who truly performs.
The actual kick rating formula is as follows:
For each player or team we can use this formula to generate the respective rating by comparing their expected output to actual output.
Thank you very much to Liam for his work developing the threat and retention kick ratings. These are now available on Wheelo Ratings for players and teams from 2021 onwards.
This is just an introduction to my ratings, next week I’ll analyse the outputs for players and teams.
Staying wide in Sydney
Cody Atkinson
Last weekend I went to Sydney. This in itself is not newsworthy. It might be the opposite of that actually.
I saw the sights, went to galleries and museums, even went to a couple of gigs. I may have even had a drink or two too many (according to my bank account at least).
And I went to the Swans, mostly to watch the game but partially to talk with Dean Cox and Ken Hinkley.
For those who didn’t watch the game was almost a classic comeback before it wasn’t. The Swans fell short, and the Power continued their surge up the ladder.
Then the explanations began.
Some may think the post game media scrum is a perfunctory exercise to provide praise, health updates and placate fans. But with the right questions – or more importantly the right answers – they can shed as much light on the modern game as any other source.
Here’s an example from a (slightly edited) question I asked Cox post game:
“It seemed like in the first half both teams tried to defend the corridor very hard and it seemed like you guys were going more and more direct. (Is) taking more risk something that you want to see going forward?
“I think there’s times where you can test and use the corridor and try and open up the corridor. But if Port use it you don’t want to force it,” Cox replied.
“And that’s probably one thing I do want to make clear to our players. Port they’re the number one D50 to corridor team in the comp…so they got a couple of goals early we sort of knew that… to the boys credit they had 29 front half turnovers so the ability to be able to stop that – they went at 15% rebound 50 to inside 50.”
There’s a few things from Cox’s brief response that are worth looking into.
Firstly – Port love to hit the corridor. All teams do, but Port are particularly corridor heavy. Instead of D50 to corridor, I’ve use the defensive third to centre square for a couple of reasons. Before round 6 Port used the corridor as much as any team in the league.
Against Sydney, Port managed to hit the centre square for chain disposals from the defensive third (behind the centre square) just *three* times. That’s massively down on their season to date.
One of those examples is likely what Cox was referring to in his statement.
Cox’s statement also hints at their strategy through the game – to wall off the corridor and induce chip kicks down the wings and long kicks down the boundary line to force stoppages.
Teams generally wall off the corridor by pushing their outside mids, wings or high half forwards near or on the “skinny” side of the square. This creates the appearance that a kick into the square will be contested at best. It’s like a puffer fish at its fullest expanded state – protecting territory through the idea of danger.
Ball is in the air in line with the three circled Swans.
That strategy played off to some degree – Port finished way ahead in marks and contested marks, and the Swans won the predominance of ground balls.
Sydney also largely decided to eschew their own corridor game – partially due to similar tactics by Port. In the capture above from a D50 set ball, no Sydney players are leading into the corridor. Opening up the corridor is often a mutual decision – one that can end in mutual destruction (on the scoreboard).
There’s a lot of jargon there, I understand. More simply, Port like to chance playing in the middle of the ground to open up their post-Dixon forward line. They aren’t the most efficient team in the league when doing so, but that isn’t critical given how valuable the corridor is.
So how valuable is the corridor? This year all defensive possession chains starting in the defensive third score, on average, 0.44 points. If you get, say, 50 of them a game you should score about 22 points from them.
But if you can use the ball from the square, the scoring rate increases dramatically. For defensive third chains that hit the square teams score at just over a point per opportunity. Across the same 50 (roughly how many chains teams average from that part of the ground) that’s 52 points per game, or six goals more.
Six goals is probably the difference between the best and worst teams in the league. Six goals in a game is a lot.
Why is getting the ball in the square so important? It makes the ground bigger, and harder to defend. Spare defenders, and third men up, can be effectively defanged due to the sheer variety of targets from the middle.
As a result, every team ideally wants to get into the corridor – sans ramifications – and wants to stop the opposition from doing the same.
That’s why Cox was clear that the green light was faint for his attacking ball users, and why his own directness was only dialed in when the game needed rescuing.
And that’s why you go to the media scrum.
Assessing the “AFL Power Index”- who are the financial heavyweight clubs?
Sean Lawson
“The numbers have been crunched, and the verdict is in: Richmond is the most powerful club in the land” reads this recent article at Codesports.
It’s a grab bag of financial and fanbase measures, but it doesn’t quite hit as an assessment of the “biggest” or richest or most powerful clubs. I’ll try and do better using annual reports collected by Jason Lassey’s amazing Sports Industry AU website to drill into what makes a club financially “big”.
Here’s what we’re working with:
The list of measures they used is a mix of financial and soft fanbase indicators as follows:
I’m not going to argue against social media and surveyed support, both seem reasonable enough tests of future growth potential.
Rather, my focus is the financial measures which I think overlook key features of the economics of football clubs.
To illustrate, I’ve compiled (partially estimated) the revenue sources for AFL clubs in 2024.
The clubs generating the most money from football itself, ie memberships, tickets, merch, stadium hospitality, are shown at the top, but the most important part of this analysis is to note the AFL equalisation distributions. The AFL gives more money to clubs have more structural need due to a smaller fanbase.
This thorough financial equalisation has been a quiet revolution since 2015, and has made club profit and loss statements largely meaningless. All clubs are supported to fund their football operation, and to run at a breakeven level. Unlike many sports, discussion of financial power has mercifully almost nothing to do with the prospects for success in the modern AFL, it’s just a fun little exercise in curiosity.
As we can see. West Coast, Collingwood and Fremantle are the biggest “heavyweights” when it comes to football revenues, with massive crowds and corporate support. Next is Geelong whose stadium deal at Kardinia Park sees them keep a much bigger cut of a smaller stadium revenue pie.
On the topic of Geelong and stadium facilities, you can also forget asset value as a worthwhile measure of club power, since AFL clubs, as a rule, barely pay for their key assets, As Greg Blood at Australian Sport Reflections notes, in nearly every case, club facilities end up on club balance sheets mostly via grants or via concessional transfers from government. That’s successful political lobbying, not financial power.
Readers will note that the likes of Richmond (in a spoon year), Carlton and Brisbane have lower football incomes than the top bracket, but big side businesses that generate high revenue. Brisbane are 4th in the league for revenue thanks to the competition’s biggest pokies operation in Ipswich, but the Tigers with their fitness centres appear to dwarf everything else.
Unfortunately, that is all just gross revenue, and the power index missed its mark in focusing on those. Nothing comes for free, and clubs need to spend money to make money:
The key goal for clubs isn’t revenue, it’s profit. These iinvestments are to provide an operating surplus for reinvestment into football.
At the moment, pokies still reign as the most profitable side business. The Lions with the largest pokies profits and the highest proportional reliance on them, made about $8m in profit last year at their venue.
Meanwhile, clubs looking into diversification into alternatives like gyms and corporate education programs are pushing into lower margin activities.
They would hope for long term profits, but at the moment, that extra revenue is not really helping the bottom line. Clubs with resources to invest are equally capable of just holding onto them and gaining a passive income though interest and dividends, instead – something several clubs like West Coast quietly do.
We can also apply this revenue vs profits question to football income. Clubs generate income from tickets, merchandise, memberships, sponsorships, hospitality, but all those things also don’t come for free.
So let’s isolate club profit from commercial football activity – how much money do clubs actually get out of their football, after they’ve booked the seats to sell to members, bought the merchandise to fill the club shop, paid the corporate comms staff, and so forth:
This chart takes the red “football revenue” figure from the top chart and shows how much of that is actual profit, what I’ve called “net football income” here.
This is probably the most appropriate key indicator for the financial preponderance of football clubs as football clubs. The more surplus a club can extract from footy, the “bigger” the club.
Some clubs have a higher football income but don’t make as big a surplus. Sydney for example has the highest sponsorship income in the league, but this comes with high operating costs, and they pour a lot of money into reaching a somewhat disengaged fanbase. Adelaide by contrast runs a cheaper operation in a quieter city and has a devoted fanbase who don’t take much “activation”.
But a key point here. Only five clubs are even capable of paying their players just from their own commercial football activity. All clubs rely on AFL distributions to fund their on-field performance.
The primary goal for all clubs is to fund their football programs, which in 2024 required 34 million dollars, about 29m for AFLM and 5m for AFLW.
The true “heavyweights”, then, will be the clubs who can reach the mark of funding their football program with just their own football profits, a base AFL distribution, and, if needed, any side income.
That’s the big clubs mentioned above – West Coast, daylight, then Collingwood, Adelaide, Richmond, and Fremantle. Essendon also meets the mark with their pokies and fitness centre revenues. Carlton might be likely to climb into this group if they were to have a run of success, roughly the way Richmond’s dynasty propelled them.
But also remember that with modern equalisation, being a “financial powerhouse” has never been less relevant to AFL success. Just ask Carlton or Essendon or Fremantle about how many premierships their money has gotten them.
Around the Grounds
Here’s some other good looks from elsewhere this week.
This clip of former umpire Ray Chamberlain explaining how holding the ball actually works is very handy to all footy fans. Ray goes a step further and suggests some commentators learn the rule.
This Week In Football is a collection of some of the best in football currently outside the walls of AFL clubs or broadcasters. Each week a curated grab bag from regular contributors and special guests will provide insight into and beyond the game on subjects of their choosing. For more about our contributors, click here.
Got an idea or want to contribute? Email thisweekinaustralianfootball at gmail dot com
Building on commentary in recent weeks, including Jasper’s piece last week, this week I’m going to take on the difficult task of dissecting bubbles.
In the modern game teams generally defend space more than they defend players. Cody and Sean wrote about this back in 2020. In the broadest and simplest terms, a defence will be relatively happy if they can make close options risky, and long options easy to neutralise – the attacking team want to do the opposite.
To maximise their chances, the attacking team needs to pose as many credible threats as possible. Even if you don’t use them on a given play, the more places a team feels like it needs to defend, the weaker its defence will be in any one spot. This is where the idea of the bubble comes in – it represents the area on field you can threaten. Initially you have a small bubble, through aggressive ball movement you can expand your bubble quicker than the defence can redeploy to defend it.
I’m putting forward one (still very much in progress) method of looking at how well teams create credible threat, by looking at where the ball has tended to go.
For this week at least, I’m limiting my scope just to intercept possessions at centre half back, which I’m defining as 40-60 metres from the defensive goal and within the width of the centre square.
Let’s cut straight to the chase and dump a great big chart and then go through some through a few observations. I’ve chosen 6 seconds after the point of intercept as our reference point because that offered one of the better points of differentiation between teams. As you go further forward in time, the majority of all ball ends up in the forward sector (the vast majority of the field is in the forward sector at longer ranges, so this makes sense regardless of game style).
A couple of quick things to consider:
Wedges are drawn at the 80th percentile of distance from the point of intercept in that sector – that is, for 4 in every 5 intercept chains the ball will be within the drawn areas 6 seconds after the point of intercept. Wedges are shaded darker based on the proportion of chains that are within that sector.
For every team other than Essendon (and St Kilda very marginally), the front sector is the most used
For every team other than Essendon, the front sector is the most used for their opponents.
Carlton and the Giants’ opponents aren’t going forward quickly – 80% of chains in the forward sector have travelled around 12 metres or less – contrast to Essendon, Richmond, and Sydney where that’s around the 50 metre mark.
St Kilda have one of the most balanced threat profiles, pretty well spread across front, lateral, and right 45s. They are also still in the back sector, but with the distance involved it looks like this is probably more from being behind the mark rather than actively moving the ball backwards.
Richmond favour long, lateral movement to the right.
There’s a few important provisos here to keep in mind:
This is very much a work in progress, and it’s something I’ll likely keep iterating on through the season
The chart presented here doesn’t differentiate between intercept marks and non-marks
This is primarily about style, not effectiveness. I haven’t represented retention rates at all here.
We are still early in the season so sample sizes are low – things will be impacted by single game anomalies and which opponents a team has faced.
The 2025 version of the Melbourne Football Club is historically inefficient. They have the 5th worst Scores Per Inside 50 Rate of any team since 2012. If you remove the 2020 COVID season, they’re the worst.
You might recall the shot map I released last week, where you could observe an abundance of white space around Melbourne’s hot spot. In reviewing their inside 50 kicks so far this season, you can see it’s not for a lack of trying.
Melbourne ranks:
18th in Kicks Inside 50 Retention, and
1st for Kicks Inside 50 resulting in a contest/stoppage
1stfor Offensive 1v1s
So where is it going wrong?
I noticed a pattern in their first-quarter entries vs Essendon. Watch the video below and keep an eye on:
Which forwards are sliding?
Which forwards are hitting up at the ball?
Melbourne’s inside 50 kicks – Keep an eye on who’s hitting up and who’s sliding
Let’s review these entries through a skill vs decision matrix, before overlaying the system component I touched on above.
Skill: There were a few clear execution issues, but it’s hard to find fault in the long bombs to the hotspot.
Decision-making: Largely okay.. Maybe a missed opportunity to use Petracca (Langdon – example 8)
System: Melbourne’s ability to transition was exceptional. But upon entering the 50, every forward wanted to slide. These kicks to moving targets towards goal require elite skill and elite athletic profiles. That’s not Melbourne’s forward line.
This issue highlights the importance of an improved balance in Melbourne’s leading patterns. Forwards who are willing to stretch the ground vertically and horizontally to maximise the space inside 50 and know when to hit up with the intent to get used or to create a vacuum of space. This is fixable. The game against Fremantle this week presents itself as a last chance saloon to salvage their season. Melbourne’s efficiency inside 50 will go a long way in determining the outcome.
Last week Cody accurately pointed out that Melbourne’s once lauded defence seems to be hanging on by a thread, even with Petty back there helping out May and McDonald. In that article he mentioned in passing Melbourne’s issues going forward, and this article builds on that, finding the KPIs that make Melbourne tick.
In 2021, when Melbourne won their breakthrough premiership, they were ranked #3 for Clearances, #1 for Contested Possessions, #2 for Inside 50s, #2 for Scores per Inside 50 and #2 for Marks inside 50.
They got it inside 50 more than almost anyone else, and they kept it in there until they scored. Much was talked about their all-star backline, but their attacking power was their secret asset.
Their forwardline was already their weakness on paper, but through great positioning, good field kicking, and a great plan, they managed to spread the load – thanks to 11 players kicking double-digit goals – with medium-tall Bailey Fritsch and breakout small Kysiah Pickett kicking 99 goals between them.
In 2025 – after five games – Melbourne currently sit #17 for Clearances, #12 for Contested Possessions, #15 for Inside 50s, #18 for Scores per Inside 50 and #18 for Marks per Inside 50. Their contested possessions, Inside 50s and Clearances were improved against Essendon on the weekend, but are still a dramatic decrease from their prime.
These five stats, which identify and showcase the synchronisation between midfield and forwardline, are the ones Melbourne have to get right in order to be at their best. Let’s call them Melbourne’s KPIs.
In 2018, when Melbourne surged into September and won their first final in twelve years – making their first preliminary final since their 2000 grand final loss – they were top six in the league for all of these KPIs. In 2021 they were top four in all five KPIs.
Clayton Oliver is doing the lion’s share of clearance work at Melbourne, currently ranked sixth in the league for average clearances, but is the only Demon in the top 50.
With a midfield mix that starts Max Gawn, Clayton Oliver, Christian Petracca, Jack Viney and Kysiah Pickett, you have to wonder how they aren’t able to at least extract the ball and get it into the underperforming forwardline (as was the issue in their doomed finals runs of 2023 and 2024).
In 2024, there were serious issues around Melbourne’s midfield that we all recognised and understood, but with the full midfield mix back – and seemingly in full health – many expected 2025 to be a different story.
The loss of Alex Neal-Bullen and Angus Brayshaw can’t be underestimated, but Petracca pushing hard forward to create a target instead of focussing on winning the clearance seems akin an effort to solve world hunger by figuring out the logistics and transport before you figure out where the food is coming from. His frustration was on display for all to see against Geelong, and it was understandable.
Whether the major issue is a poor gameplan, a lack of cohesion from a recently very disgruntled playing group, or the fact that these stars just aren’t the same players they used to be – Max Gawn is 33, Jack Viney is 30, and Petracca almost died last year – remains to be seen, but whatever it is, it needs to be fixed in a hurry or this is going to be a very long season for Melbourne fans.
Inspired by Australian sports trivia doyen Sir Swampthing’s recent tweet pointing out that Gather Round was the highest-scoring weekend of footy since Round 2, 2017, as well as persistent claims by pundits that the game is becoming ever faster and more open, I decided to dig into the numbers and divine some truths: is footy actually becoming higher-scoring? How is the composition of scoring changing? And what conclusions – at least tentative ones – might we draw about the future direction of travel?
Some findings were as expected. Others, meanwhile, cut against the grain of expectation.
The first and most banal conclusion is that, yes, we are in the midst of a clear upward trend in scoring.
The chart below shows how many points sides have scored per game since 2017. Shortened quarters from 2020 are prorated for comparability throughout this piece.
Early in, 2025 is the highest-scoring season since 2017. That’s a reasonable sample size. At the same point last year, scores per game were within a point of the final season average.
Let’s turn our attention to score sources – which holds the first finding I’d describe as mildly counterintuitive. Despite the frequency of claims that ball movement is the crucible of modern footy, chains beginning from stoppage wins have contributed an increasing share of scores in every season since 2021.
Just because an increasing share of scoring is coming from stoppage chains doesn’t mean that ball movement isn’t becoming more important. Getting the ball from the inside of the contest to the outside and then advancing up the field surely counts as “ball movement” just as much as affecting a turnover. That feeds into the next chart – where scoring chains originate.
This may be the first indication of a true shift in how footy is being played.
Ignore centre bounce. It’s a peripheral and, as Cody and Sean flagged in their piece last year, flukey source of scoring.
The steady increase in scores from back-half chains is suggestive of teams placing a greater premium on the offensive (and defensive) value of moving the ball from back to front. It’s just a shame that publicly accessible data for this metric only dates back to 2021, immediately after the peak of Damien Hardwick’s famously forward-half intensive Richmond side.
The evidence for “ball movement” showing up in overall league scoring is somewhat ambivalent. The share of scores generated from turnovers is declining while scores from back-half chains are increasing. Surely, though – surely – the game is becoming more transition-oriented? After all, that’s what every pundit has been saying. Actually… the evidence for that is mixed. The chart below shows the average number of possession chains per side per AFLM game since 2017.
Possession chains count how many times a side begins with the ball. Right now, despite 2025 being the highest-scoring season since 2017, it also features the fewest possession chains per game.
Clearance numbers have remained very steady in the entire observation period. Instead, most of the observed decline in the number of possession chains is driven by declines in the number of intercept possessions per game. Again, a chart – and again, the 2020 caveat.
I interpret this as robust although perhaps slightly counterintuitive evidence for the significance of “ball movement” in today’s game. Possession isn’t just a sword. It’s also a shield. The better you are at keeping the ball, the fewer opportunities the opposition will have to score.
The average number of opportunities a side will have to generate a score is in decline. But the evidence suggests that sides are becoming much more adept at scoring when they win the ball – regardless of how they win it.
2025 marks at least the fifth straight year where the expected value of winning a clearance has increased. The expected value of turnover chains are a similarly strong upward trend. Teams are better at keeping the ball partly because the cost of losing it has probably never been higher.
What about shot type? With thanks and credit to Andrew Whelan, creator and keeper of the extraordinary Wheelo Ratings website who personally supplied me with the shot type data:
Since 2017, set shots vs general play have been very consistent, so it’ll be interesting to see whether the large shift between last season and this season persists.
A related trivia question: one side has clearly scored more of its points from general play shots than set shots to date in 2025 (another is about 50/50). A shout-out in the next edition of the One Percenters newsletter to anyone who correctly guesses the identity of that side.
Assuming these numbers a) are accurate; and b) hold, I think the most salient question to ask is how are teams becoming so much better at generating scores? Here’s where I agree with the common wisdom: players today are more skilled, attacking schemes are more mature, and (this bit is slightly more speculative) the defensive schemes to nullify them perhaps haven’t quite advanced at the same pace.
However – this is where it gets properly impressionistic – I wonder if we’re seeing the evidence of something deeper: a shift in the overarching philosophy of how we view and play the game. The evidence is there in a more qualitative way, if you look.
The best sides are lauded for their aptitude and speed with the ball. Winning “the contest” has never been more weakly correlated with winning actual games. It even feels like the value of defenders is increasingly measured, both in analytical spaces and also the digital pub surrounds of Bigfooty et al, by how much they contribute in possession. There have been higher-scoring seasons and eras. But I’d argue they were functions of either a tactically immature game (prior to the early 2000s) or super-dominant sides which overwhelmed the competition by stacking tactical and talent advantages (see: Alastair Clarkson’s Hawthorn).
This feels slightly different, almost as though the fruit is both riper and more evenly distributed. In that regard, our current direction of travel reminds me just a little of the attacking revolution that swept through elite club soccer around the end of the 2000s – and hasn’t really abated since. Long may it continue.
Who hasn’t lost a defensive one-on-one contest this year?
One of the more enigmatic statistics Champion Data and the AFL publish is the contested defensive one-on-one, with the catchy acronym of CDOOO. A one-on-one contest is defined like this:
One-On-One Contest: A 50-50 contest that occurs after a kick, and involves only two players – a target player and a defender. Each player must have a reasonable chance to win the ball in order for a one-on-one to be recorded. Winning and losing percentages refer to how often a player wins the ball or concedes a possession to his opponent. A neutral result is recorded when the ball is spoiled or results in a stoppage.
CDOOOs are those that occur in the back half for a given player, and they do have limitations under this definition. Most obviously, weaker team defences can concede more solo contests, which even if won well, may not be what the team wants.
And that requirement for a reasonably even chance in the contest also matters. If you as a defender can’t get into an even-money position and are simply fully beaten, you may not even be tabbed with the contest and loss, but can’t really be said to have done your defensive job.
Regardless, though, they contest stats have become a nice way to try to evaluate the defensive prowess of individuals who are often pretty difficult to measure and track.
A quick look at last year’s leaders shows that it mostly passes the eye test – Harris Andrews and Sam collins facing a lot of these one v one battles with aplomb, losing very few. Less accomplished defenders spreading upwards into higher loss rates, some well organised cover defences like the Swans and Saints facing relatively few isolated 50:50s at all.
It’s a quirky number, though. The requirement for the contest to be approximately 50:50 and isolated keeps the numbers relatively low, which makes assessing things tricky early in the year.
Currently, Darcy Moore has faced the most 1v1 contests this season, 20. Poor Harry Edwards sits second and looks beleaguered, having lost almost half of his contests.
Moore, interestingly, is seeing contests at double the rate per game he faced last year, which suggests his role may be worth watching as part of the Pies’ more winning approach so far this season. Leaving him more exposed may be enabling more aggressive positioning elsewhere, relying on his individual talent to cover some extra risk-taking
And Moore has delivered, with only the lost one contest. When did he lose this? Contested losses are difficult to pin down in the AFL app’s generally well tagged statistics-based highlights, because if a player is beaten, they usually don’t record anything taggable (unless they lose by giving a free kick).
What we can say is Darcy Moore’s only contested one-on-one loss so far this year came against the Bulldogs. I suspect it may have been whichever of the six Sam Darcy contested marks was deemed something approximating a 50:50 contest:
That brings us to the question here. Which players in 2025 are yet to lose a one on once defensive contest and how long can they last?
In 2024, for comparison, the most contests without a loss was 8 by Jarrod Berry. It’s hard to sustain a fully clean sheet.
Here’s everyone who’s seen at least 5 one v one contests without losing one:
Player
Team
CDOOOs without loss
Jacob Weitering
Carlton
9
Sam De Koning
Geelong
7
Lachie Jones
Port Adelaide
6
Jeremy Howe
Collingwood
6
Max Michalanney
Adelaide
6
Brady Hough
West Coast
6
Brodie Grundy
Sydney
5
De Koning and Grundy are playing a different game to everyone else, both being players largely defending their opposite rucks and being notable for beating them on the deck. That may keep them in good stead against the rest of these defenders who could at any point find themselves out of position, pinned to a mismatch or needing to concede a professional free kick.
Who holds out the longest? Which new contenders will emerge? We may check back later in the year.
Kicking with width
Cody Atkinson
The ABC yesterday published an article about handballing – no need to read it…if you insist…but one thing that intrigued was that in recent years the share of handballs to kicks had actually plateaued a little. Not a great deal, but the mountain may have crested a decade or so ago.
That raises the natural question around the other part of the equation – that of the kicking game.
Last year’s Brisbane Lions kicked it more than any other side proportionally. This year it’s another recent premier that is leading the way.
Brisbane’s ability to shift defence by foot has grabbed the attention of opposition teams – as well as some that have begun to ape the trend. For Geelong this kick heavy style is nothing new – it’s how they have been moving the ball over in recent years.
The Suns represent the antithesis of this tactical shift. Their games have fewer kicks than any other teams, and a lower kick to handball ratio to boot. The Suns not only mark the ball less than any other side but they also allow fewer marks than the rest of the competition.
That unspeakable ABC article above included one interesting item at the start – the longest goalscoring handball chain of the year from Port Adelaide. That shouldn’t come as a huge shock – the Power is firmly in the Hardwick school of handball heavy play (despite being strong for marks).
The longest kick chain that has ended in a goal this year? Well, that would be the Dons – another normally kick-resistant side.
Of particular note is the Dons use of width and patience in moving the ball. Even as the commentators egg the Dons via telepathy to use the handball the Dons mostly hold firm. With 13 kicks to just one handball, and a couple of fairly large shifts across the ground, the Dons slide the Hawks around with ease.
Geelong in their longest kick-exclusive scoring chains show a similar steadfastness in their speed, while utilising the whole width of the ground. Shannon Neale’s goal to open the fourth quarter against Melbourne saw the Cats go the full width of the (narrow) Kardinia Park twice.
Making sides defend the full field is critical to finding space and mismatches in the modern game. The handball – and actual footspeed – isn’t the only way to do so.
Are the 2020s becoming the decade of the old bloke?
“Age is just a number” has long been the sentiment generally only offered by the most punishing exercise guy that you still follow because you went to high school together.
But watching Patrick Dangerfield steamroll Adelaide last weekend at an age that would normally have commentators talking about him like an archaeologist would a well-preserved dinosaur fossil made me wonder: is 30 becoming the new 28 in the AFL?
30 has always been perceived as the footy cliff; the Great Dividing Range where a player goes from In Their Prime to Wizened Old Sage (or worse: Over The Hill), but the best players now seem capable of squeezing every last drop of juice out of their bodies – and perhaps more pertinently, minds – to a greater degree than ever before.
Clearly it’s likely to be due to advances in professionalism and conditioning, as well as the players’ own personalities – it’s hard to imagine Scott Pendlebury spending his offseason mainlining Bintang and mushy shakes in South East Asia for example.
Arguably as a big a factor, however, has been a willingness on the part of both player and coaching staff to adapt. Dangerfield is the perfect example: With Tom Hawkins and Gary Rohan both moving on, the Cats needed another presence inside 50 and the decision wouldn’t have been made on a whim.
The Cats would have reasoned that Dangerfield has the explosive speed and power, overhead ability, ruthlessness and contested marking to be a genuinely difficult matchup inside 50, rather than a player who had an attribute mismatch against their direct opponent that characterises most midfielders who push forward to impact the scoreboard.
It’s easy to be cynical about such a switch – moving a great one-on-one player forward of the ball isn’t exactly rocket science – but the fact that Dangerfield started the first game of the season inside 50 rather than at the centre bounce was a flex that both club and player are on board with the ploy. It’s not just Dangerfield who is redefining himself in the post-30 landscape either – a torn Keidean Coleman ACL last year famously led to Dayne Zorko moving to half back at 35 years old and making the All-Australian team in a flag year.
Other 30+ players have had career seasons and moments in the 2020s – Tom Hawkins was a 4x All-Australian and won a Coleman and a flag after 30, Isaac Smith was a Norm Smith Medallist at 33, Scott Pendlebury calmly orchestrated a Collingwood flag in the fourth quarter of the hottest grand final of recent memory as a 35 year old, and Steele Sidebottom stretched every millimetre of his 32 year old soft tissues to kick the sealer in that same game from platform 1 at Jolimont station.
Incidentally, Pendlebury is now 37 and seems to be cruising towards Boomer Harvey’s all time games record – and who knows how many more games he’d have had to his name if player and coaching staff could have found a middle ground at the end of 2016?
Around the Grounds
Here’s some other good looks from elsewhere this week.
For a less gamestyle and numbers oriented companion to our looks at The Melbourne Question, Jonathan Horn tries to read the mood and psyche of the team.
This Week In Football is a collection of some of the best in football currently outside the walls of AFL clubs or broadcasters. Each week a curated grab bag from regular contributors and special guests will provide insight into and beyond the game on subjects of their choosing. For more about our contributors, click here.
Got an idea or want to contribute? Email thisweekinaustralianfootball at gmail dot com
This week the entire footballing world congregates in the city of churches to watch as much top level footy as is possible in one weekend (outside of Melbourne). Nine games in nine timeslots in one city(ish) offer the most dedicated of footy fans the opportunity to overdose on on-field action.
It’s also rare that all eighteen clubs are in one place at roughly the same time. It provides the opportunity for discussions great and small between footy staff – hopefully away from the gaze of the tabloid media. Loose lips sink ships, or so the saying goes.
Week five is also getting preciously close to the point in a season where there’s enough information to really form opinions about teams across the league. This holds even stronger for clubs that have changed coaches or methodologies over the summer. A month and a half provides enough tape and data for opinions to form, and become concreted in. Opposition analysis gets easier to run after this point, and teams will increasingly start to adjust to these changes.
There’s also the real chance that a team or two comes out of Gather Round with their finals hopes severely dented, if not scuppered entirely.
This Week In Football we have:
False Starts and Flag Fancies (on Fremantle)
Eppur si (non) muove (also on Fremantle)
Elements of Speed (you’d be shocked but also Fremantle)
The fresh ball movement data underlining Carlton’s horror transition game (surprisingly, about Carlton, not Fremantle)
More is not always better (not Fremantle)
What is the real Gather Round cost? (also not Fremantle)
The breakdown of a breakdown (about Melbourne, not Fremantle)
False Starts and Flag Fancies
Ryan Buckland
If I were shown a picture card of the current AFL ladder as part of a psych evaluation and asked for the first thought that popped into my head, it would be the disappointment that is the Fremantle Dockers.
With the team tucked away safely on Sunday afternoons, you probably haven’t been tortured the way I have so far this year. A team with top talent on every line, a credible and settled back six, adding Shai-frickin-Bolton, just can’t seem to Put It Together.
That’s my diagnosis. For fits and starts, the Dockers are breathtaking in their endeavour, their speed, their skills. But when the synapses need to fire on a balmy Perth winter’s afternoon in June, the drool starts pooling and the thousand-mile stare sets in.
Coming into the season Fremantle was a consensus top four selection. Bolton was the finishing touch on a team coach Justin Longmuir had spent five years curating, and it was all supposed to work. The results so far have been anything but the play of a team bound for September. The groans of a weary Dockers crowd – so conditioned to disappointment, so ready to feel it, but still not accepting of it – are already ringing in my ears.
Something said on the Sunday broadcast piqued my interest, and not (just) as a chance to sink the boot into little brother: the Fremantle Dockers haven’t grown up.
In a league which the excellent Cody and Sean are telling us is getting older by the year, the Dockers are getting younger. In fact, in the Longmuir Era, Fremantle’s selected team age profile has been below the league average every single week.
Ross Lyon, still the only coach to take Fremantle to a Grand Final, oversaw the early years of deleveraging once it became clear the team wasn’t quite good enough to win it all. Between 2015 and 2019 the average age of the selected Fremantle side declined from a peak of 26.7 years (~1.5 years above league average and the oldest team in the league) to a low of 24.3 years (~0.8 year below league average and amongst the youngest).
Hence, the team has bubbled along below league average, rising and falling but staying anchored in the depths of inexperience.
All things being equal, if a club picks 23 players and the team doesn’t change from one year to the next, the average age will go up by a year. The fact Fremantle’s age has continuously fluctuated around the same marker for each of Longmuir’s five seasons hints this isn’t happening.
This is a significant contrast to teams who have contended for flags for long periods of time over the past decade.
Consider Richmond, from 2016 to 2022, Brisbane from 2018 to 2024, or even West Coast from 2014 to 2020.
That’s a few selected examples (you can play with the data here). But pick any team who has been at the top for a sustained period over the last ten years and the same broad pattern repeats. Settled coach. Core team forms. The age and experience of the selected team grows by the week, and the contention window opens.
The Dockers have been hit hard by player departures over the past few seasons. Bradley Hill, Blake Acres, Lloyd Meek, Liam Henry, Jesse Hogan, Adam Cerra, Rory Lobb, Griffin Logue, Darcy Tucker and Lachie Shultz all left the club between 2019 and 2023. None of them are out of the league yet, suggesting they could have been critical cogs in the Longmuir machine.
They have been replaced by some experienced players coming through the doors, but in the main the Dockers have leaned into the draft. Murphy Reid, a strong Rising Star candidate for mine, is the latest in a line of quality players taken in recent years.
Fremantle want to play a very precise, controlling game. This is evidenced by an excellent observation of Emlyn Breese this week: the 2025 Dockers have the highest rate of kicking from behind the mark of any team since this stat is available to mere mortals. The second highest is the 2021 Dockers.
Longmuir himself moved over to a permanent employment contract with the Fremantle Football Club before the start of this season proper, ala Brendon Bolton at the Blues before him. Interpreted as a sign of comfort between coach and club, could it have been tacit recognition that there’s still a ways for the Dockers to go before they reach their apex?
A fortnight of opportunity to show us what they’ve really got awaits, with the young Tigers on neutral ground and hapless Dees on the wide expanses of the MCG on the slate. Anything less than eight quarters of excellence will be a resounding answer to this question.
In news that will surely make David King’s heart sing, Fremantle are by one metric the most stop-start team of any from 2021 onwards.
In the season to date, only 26.4% of frees or marks to Fremantle sees them do something other than taking the kick from behind the mark.
The next lowest is also Fremantle – in their 2021 incarnation – at 27.5%.
This year has an outlier at the other end also – This year’s Giants are the highest from 2021 onwards at a rate of 38.7%.
Now, the lowest from 26.4% to the highest at 38.7% gives a relatively narrow band, so let’s see if we can unpack it a bit more. A decent chunk of frees and marks in the forward half will be in viable scoring range. Most of the time a team is going to go back and take the shot – or at least think about doing so and then potentially find a pass in a better position.
If we only take marks/frees in the defensive half the differences become far more apparent.
Fremantle in 2025 are still the lowest we’ve got on record at 28.2%, but the highest we’ve got is up at 52.3%, and they’re another 2025 team.
In fact, the four highest on record are all from 2025 – Gold Coast (52.3%), Port Adelaide (46.0%), Essendon (45.2%) and GWS (44.3%).
If we limit it even further just to defensive half intercept marks and frees Freo are yet again the lowest in our records (17.6%), and four 2025 teams are on top, although not all four are the same – Port Adelaide (43.5%), Sydney (43.0%), GWS (41.9%), and Collingwood (41.7%)
Now, this may change over the course of the season. Small sample sizes will often lead to outlier results, but it’s certainly something worth keeping an eye on.
Off the back of Emlyn & Ryan’s analysis, let’s continue with the Fremantle theme. Here is a snapshot of how long it takes each team to dispose of the ball from a mark.
Fremantle are clearly the slowest team in the comp across all three zones leading into the forward 50m, closely followed by Collingwood. Essendon, Brisbane and Geelong like to keep the ball in motion. St Kilda, Richmond and West Coast appear to speed up as they move the ball up the ground, while the likes of Gold Coast and Carlton get slower.
These stylistic differences can part personnel, part where the game is being played. If you’re a front half team generating intercept marks high up the ground, you may need to be patient, rather than blazing the ball back into congestion. If you’re winning the ball in your back half with elite foot skills at your disposal, you may prefer to slice your way up the ground with quick release kicks.
If you’re neither of these, you may prefer slow long-down-the-lines while over-indexing at the contest to win the chaos game. There’s no right or wrong if everyone’s on the same page.
The fresh ball movement data underlining Carlton’s horror transition game
Jasper Chellappah
New ‘speed of ball movement’ captures from Champion Data in 2025 present a clear summary as to where Carlton’s transition footy is at. These metrics need to be unpacked, but they back up a fair bit of what you can figure out watching the 0-4 Blues yourself. They routinely panic bomb the ball on top of their key forwards’ heads, neglect to create overloads in transition and frustratingly go slow when they have the opposition on their heels.
Thanks to CD’s Chistian Jolly on the ESPN Footy Podcast for these fresh numbers.
To start, the Blues move the ball fastest of all 18 teams from an uncontested mark. That is to say, from the point that an uncontested mark is taken anywhere on the ground, Carlton players gain the most metrage in the least amount of time. Conversely, the Blues are the fifth slowest team in moving the ball from a contested mark. Let’s dive into what that means in a footballing sense.
When the Blues find an uncontested mark they throw the game back into chaos more than any other team. There’s little regard given to retaining possession, picking holes through defences and methodically working up the ground. In reality, AFL defences are best set up when allowing an uncontested mark – it often means midfielders have rolled behind the ball and allowed the open space. It’s been rare to see the Blues retain possession and work the ball up the ground through switches and the ‘45’ corridor kick. It shows in the fifth least uncontested marks per game.
Given they’ve struggled to retain the ball, it’s mind boggling to consider that Carlton would consistently bomb the ball forward to outnumbered situations. With no method to the madness, the Blues are systematically kicking long into set defences and turning it over from positions of advantage.
The game is quicker than ever before. But moving the ball quickly isn’t always wise, and the best teams pick their moments. For example, moving the ball long and direct when the opposition is well set up is not the method of Brisbane, Collingwood or Geelong, our three most recent premiers.
Michael Voss shoulders as much of the blame for this as his charges. It’s a game plan contrived from the ideals of territory footy and metres gained, where winning the midfield battle would more often than not win you the game. But footy has changed and the Blues haven’t changed with it.
What makes these numbers all the more confounding is the fact that Carlton is the fifth slowest team to move the ball from a contested mark. You can probably envisage those moments – where a bruised and battered Charlie Curnow has taken his time up off the ground after a big pack mark on the wing, or where Jacob Weitering’s intercept hasn’t kick-started transition but rather led to a slow-play bomb down the line.
They take the third most contested marks per game so it’s not a rare aspect of their makeup. Carlton win the aerial 50-50s better than the vast majority but concede any advantage they gain.
The Blues have elite aerialists in Curnow, Weitering, Tom De Koning and the returning Harry McKay. The upside of contested marks around the ground is opposition defences are typically unset. There’s space out the back or pockets of open grass in the corridor to exploit. These are the moments where good teams go quickly, take ground with handball chains or inboard kicks and drive the ball deep inside 50 over the back of the scrambling defence.
Adam Simpson explained this concept on AFL360; the ‘small bubble’ and ‘big bubble’ in relation to the fastest ball movement side in the AFL, Brisbane. As soon as they took a mark the opposition wasn’t willing to concede “the bomb goes off” and scoring opportunities present.
Adam Simpson's latest masterclass on team defence and how the extra man can heavily influence the game.
Applying this to the Blues, as soon as they take a contested mark they expand the bubble and the bomb should explode. But it doesn’t. Instead, Carlton becomes the slowest team in the league to move the ball. These are rolled gold scoring opportunities being snuffed out by a lack of recognition and impetus.
The Blues are playing transition footy the wrong way around. They kick long to shallow inside 50s off uncontested marks and go painfully slow after opening the ground up with contested marks. It therefore makes sense that the club is top four at intercepting the ball in the air, but bottom two for scores from turnover. This group sits at the bottom of the league for disposal efficiency and leads all comers for clangers per outing.
There’s an issue of personnel, but on these metrics the Voss game plan simply isn’t stacking up with modern footy standards.
Cody makes some great points about the potential benefits of allowing certain players extended stints on the ground.
But after reading his piece I couldn’t help but think about the fact that just because a player spends a lot of time on the ground doesn’t guarantee they will have a significant impact on the game.
For example, Ben McKay, who averages 99% time on ground across the three games he has played this year, has copped it from all angles over his performances thus far.
Which leads me to ask the seemingly obvious question: who has spent a lot of time on the ground but had little to no impact on the game?
(I will admit that I originally wanted to look at the relationship between distance covered and impact, but that question will have to wait for another day as detailed Telstra Tracker data are not publicly available, as far as I can tell.)
It’s worth noting the AFL Player Ratings only measures direct impact. For key position defenders a lack of impact can often be a positive – a sign that an opposition side is unwilling to attack them, or unable to due to superior positioning. Until there’s further development in this space (such as from including player tracking information), there’s missing information for the effectiveness of defenders.
The AFL have an official measure of the direct impact each player has on a game – player rating points – so we can use that in our attempts to find an answer.
The table below displays the minimum, maximum, and average AFL ratings points for players who average at least 95% time on ground across at least three games. As Cody highlighted last week, the list features a lot of key position defenders.
McKay doesn’t have the lowest recorded player rating in terms of an individual game – that “honour” goes to Brisbane’s Harris Andrews for his 12-disposal effort in the Lions’ 28-point win against Richmond over the weekend.
But he does have the lowest average player rating, with scores of 6.4, 5.9, and 4.0 from his three games to date.
Essendon fans will be hoping the week off will be just what McKay needed ahead of their Gather Round clash against Melbourne on Saturday night.
At the other end of the spectrum, Carlton’s Jacob Weitering just edges out Sam Taylor (Greater Western Sydney) and Tom McDonald (Melbourne) as the player who has spent the most time on the ground and had the greatest apparent impact on the game during said time on ground.
The Blues have left their fans frustrated this year, sitting with a 0-4 record despite leading at half time in each of their matches. If the same happens against the bottom-placed Eagles this week, Weitering’s consistency will be of little comfort.
Gather Round is generally regarded as a success for the South Australian government, with the whole city seeming to get decked out with inflated footballs, club colours, and advertising boards, while several thousand travelers roll in to fill the hotels, and the eyes of the footy world fall on Adelaide for a few days.
All this comes at a monetary cost, however, with the ABC currently estimating 16 to 20 million dollars a year being spent by the government on the event. This is a fair chunk of money, easily the most ever forked out by a government other than Victoria’s on the rights to host footy games. The SA government outlay was enough to get the AFL to quietly put aside any plans of using its answer to the NRL’s Magic Round as a tool for footy promotion in New South Wales, an idea that eventually became the much more watered-down Opening Round concept without the actual addition of extra games to the schedule.
But how does the Gather Round expenditure, as reported, actually stack up with other outlays by state, territory and local governments for AFL content?
The Gather Round deal, taking $18 million as the median of the most recent reported values, costs almost double any other AFL content deal on a per game basis, with the WA government spend to bring North Melbourne to Bunbury and Perth, and the Hawks’ new Launceston deal the other contracts currently costing over one million dollars per game.
However, Gather Round caters to some fairly large crowds and when looked at on a per-attendee basis, looks about middle of the pack with the most comparable deals, roughly on par with what the ACT government spends bringing footy to Canberrans.
This also means that if other states do try to force the issue with the AFL before Gather Round gets entrenched as a permanent fixture in South Australia (and a permanent fixturing leg-up for its teams), another state is probably going to have to outbid the total expenditure, and in doing so they’ll perhaps do it without any guarantee of comparable crowds in isolated Perth or non-football heartland Brisbane or Sydney.
The breakdown of a breakdown
Cody Atkinson
Zero and four is not a good start to a football season. This is where Carlton, Melbourne and West Coast fans start to wince in unison.
But for all the issues to date with the Blues and Eagles in 2025, let’s turn our attention instead to the side that has most recently been premiers.
Most would point to Melbourne’s forward line as being the biggest source of their issues. After all, they’ve struggled to get the ball forward, mark the ball up forward and score at all.
The three teams at the bottom there? Yep, the 0-4 club. But let’s ignore that for a second – just a brief one.
When Melbourne was at their competition beating best it wasn’t because of their attack but instead their defence. Led by Steven May and Jake Lever, the Demons were as solid down back as any other side – providing room for their sometimes sputtering attack to…well, sputter. Between their defence and the weight of ball they could win from stoppages, the Demons could grind sides into submission.
This year their defence has struggled to find its rhythm through personnel issues and what seems to be broader communication problems.
This is ugly stuff. There’s at least five errors in the clip above – from not denying space for the lead, to not communicating who should be marking who, and even the poor kick at the start. Despite all of this Melbourne still spoil the kick (partially due to Stengle cutting the lead), but don’t have effective support at ground level to stop Dangerfield.
Again – how do you leave PATRICK DANGERFIELD so open in the forward 50?
The Demons are struggling in stopping both raw volumes of opposition scoring shots, and allowing high quality shots against them. Melbourne is bottom four in both these measures – usually a sign of a very, very, very bad defence.
At times Melbourne seems stuck between a more zone based defence – protecting space instead of players – and a man defence with spares utilised for protection. At times – from the comfort of the couch – it appears that exact roles and responsibilities aren’t getting communicated on the field effectively.
To be fair to Mebourne they have struggled with availability. However, with Jake Lever out for up to two months, this may not get better any time soon.
Melbourne are running out of time – if something doesn’t change soon, their season will be over early.
Around the Grounds
Here’s some more stuff that isn’t from here but is good to take in about footy