This Week In Football is a collection of some of the best in football currently outside the walls of AFL clubs or broadcasters. Each week a curated grab bag from regular contributors and special guests will provide insight into and beyond the game on subjects of their choosing. For more about our contributors, click here.
Banner images by Polly Porridge of the True Bloods Podcast. Check out her other design work.
Before the Bounce
Round 2 of the season, so naturally four teams had a bye this weekend and there won’t be a full slate until Gather Round. The teams that get out onto the park though put on some great displays, only leaving us with two undefeated and three winless sides and half the competition sitting at 1-1.
The Hawks, Dogs and Suns all firmed their premiership credentials displaying three distinct archetypes of wins that hearten the faithful: straightening your kicking for goal when it matters, wrestling back the lead late on in tough away conditions, and completely dispatching cellar dweller opposition.
At the other end of the ladder the Giants, Bombers and Roos all had three variations of disappointing losses: the complete absurdity of losing 29 seconds of game time to the void and going on to lose by a single goal in a late charge, cementing yourself as wooden spoon favourites after being unable to fire a single shot against a fellow bottom four team, and giving up a five goal lead to a team you sold the reverse fixture hosting rights to.
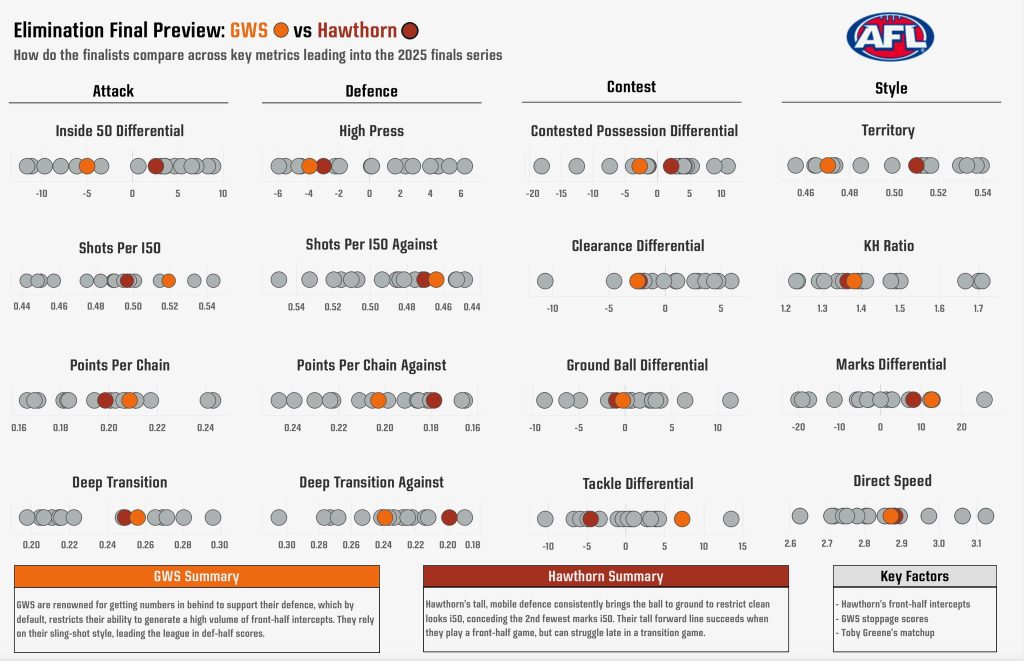
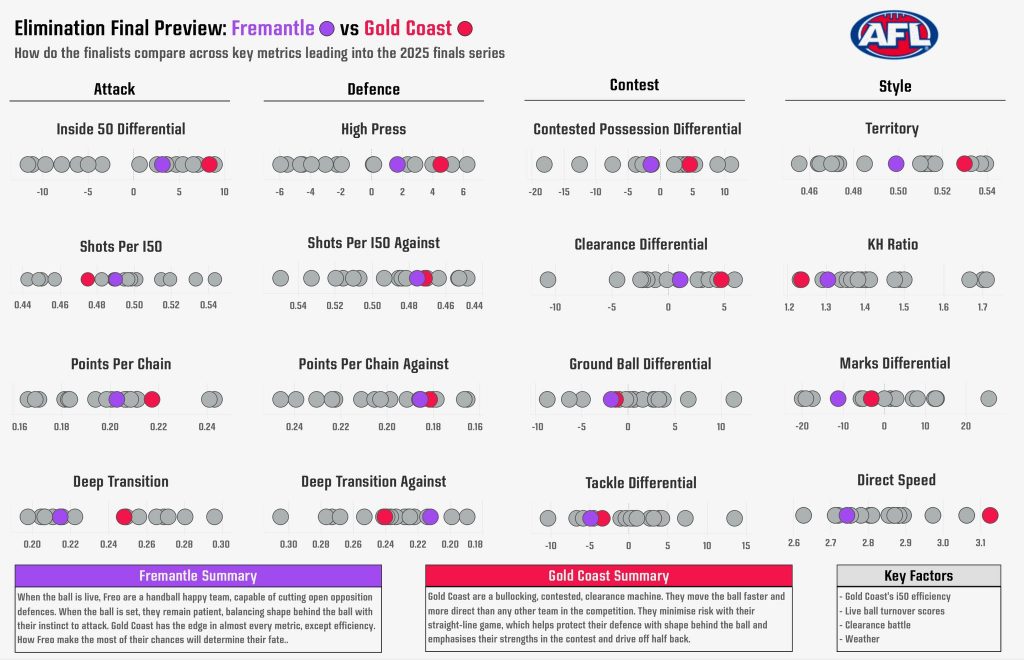
Finally in the middle of the pack, maybe now called the Wildcard Zone, Fremantle showed they learned how to hold onto the most dangerous lead in football: 5+ goals at QT.
This week in football we have:
- Cody Atkinson: Rescuing Footy
- Jeremiah Brown: The Shifting Marking Market
- Lincoln Tracy: The Early Season Spike in Scoring isn’t as Big as you Think it is
- Emlyn Breese: Tracking the Tracker
- Joe Cordy: Setting Up The Board
- Around the grounds
Rescuing Footy
Footy – or Australian Football to give it its government name – has been around a fair while.
But the game as created wasn’t perfect. The first rules were more a rough sketch than a considered masterpiece.
That’s not a shock – they were literally bashed out on a lazy arvo at the pub by whoever was keen enough to show up. Had they considered continuing through kick-ons they might have had something bulletproof on their hands, but c’est la vie.
Since then there has been an obsession with fixing football. As something created broken, the obvious response has been to repair. When the little mark took over the game, they removed it from the rules. Holding the ball has been an issue for over a century, as has the throw. The shirt front is no more, and now the ground has a lot more lines than before.
There are three general types of fixes that are generally enacted.
The first is safety related changes, and are pretty essential for any sport to continue (i.e. no shirtfronts anymore). The second is loophole closing – think the little mark. That occurs where a team or teams exploit a poorly written law to reign supreme (and ruin the fun of the game).
The third type is a bit more nebulous – it’s to make the game better. In recent years there have been several changes to attempt to improve the game. That’s also the case this year.
That last type of change rumbled around my head when I read this tweet from the Herald Sun’s ‘Ralphy’.
Imagine being a fly on the wall in those conversations. Imagine thinking that a bunch of journos with a questionable grip on the sport knew the levers on how to fix the sport.
Most importantly – imagine thinking those trade-offs were something real.
So is the game actually improved this year?
It’s far too early to tell, but almost certainly not.
Most of the baseline numbers that indicate style are basically unchanged this year, especially when considering that early season (and year) footy is usually faster and higher scoring due to conditions. Most club analysts generally think that a month to six weeks is the earliest period you need before trends are analysed in a footy context – we aren’t close to there yet. Some even suggest to wait until after the league-wide bye. That’s because the bye is the main opportunity teams have to install new looks with extra time on the training track.
As we’ve (Sean Lawson and I) have investigated in the past, most rule changes see a short term bump to scoring (or other relevant factors) before settling. Time is needed for the full impact.
But let’s be bold and take one short term example anyway – mostly because of the consensus view that there has been a dramatic change. In Mateo’s latest One Percenters newsletter, he highlighted some numbers from TWIF’s own Emlyn Breese:
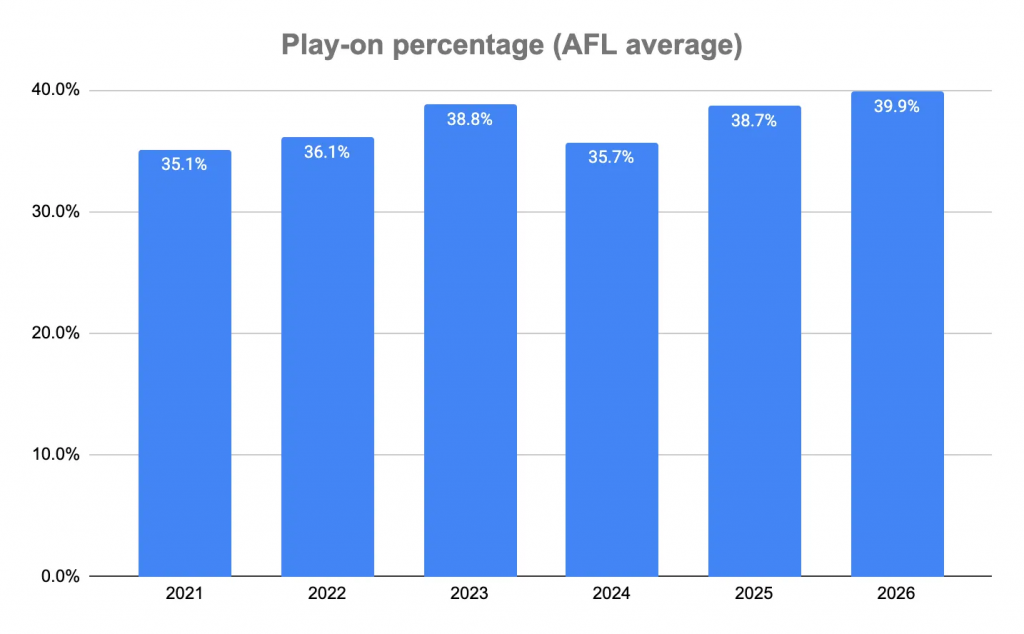
Play on rates – often cited as the big outcome from “stand” – haven’t shifted dramatically. Likewise, transition of the ball from defensive 50 to attacking 50 is actually a touch down. Scoring from centre bounce is down as well. Scoring is up overall (see Lincoln’s piece for a discussion there), but the game looks (with the commentary on mute) largely the same as last year’s sport.
Yet still most people would observe the opposite. They would see a game dramatically sped up, perhaps artificially so. So far that’s just not the case.
A large chunk of this would be down to what we are watching for – a filter on how we watch the game through the narrow lens of the television screen. If we are looking for overlap run (and commentators likewise) then we will see it.
This Russell Jackson piece is always worth re-reading on the latter issue.
That addresses the “what” but not the “why”.
So “why”? Why are these rule changes being made if not for the big two reasons above?
Well, without detailed research, my best guess is to serve the nostalgia of journalists like Ralph and the footy administrators in charge. They want a game like the one they remembered growing up, with hormones racing through their veins. They want to see the loose, carefree, energetic footy that matched their outlook in life that the time – when things were as good as they would ever be.
This absolute tune from Hot Tubs Time Machine probably explains it better than I ever could.
People want goals, action, marks. They want bags of goals – journos in particular want this because it’s easy to write about. More importantly, they want to relive the heroes of their youth and what they did to make them so, well, heroic.
Marcus from Hot Tubs unintentionally touches on one of the major factors in why we don’t – the professionalism of the sport. As the sport has become more of a going concern the tolerance for racism, sexism and homophobia has significantly reduced.
So too has the tolerance for losing, especially if your career depends on winning. That’s a reason why there has been such a rapid tactical evolution, alongside the impact of other sports. That drive for professionalism and improvement drives both aspects. Perhaps there’s a way to make the game as open as the 1980s or 1920s (yuck in both respects), but “stand”, ruck jumping, 6-6-6 and last touch out of bounds don’t scratch the surface.
Unfortunately, the march of time is as unrelenting as the receding of the hairline up the scalp. If you actually go back and watch old football (as I often do) you’ll be quickly reminded how barely watchable it is. The conditions are often bad, the skills often lacking and the strategy oft rudimentary. It’s the emotions that are worth remembering, not the actual footy sometimes.
But old footy is simpler to understand than the modern game – an output of the professionalism forced on the game, influenced by those who communicate it to the masses.
That’s not really an issue – especially when more fans are watching the sport than ever before, and when more people are playing at a grassroots level. If the game was truly in dire straits these numbers would have dropped off.
Footy always needs fixing, but maybe not in the way people have been thinking they need to.
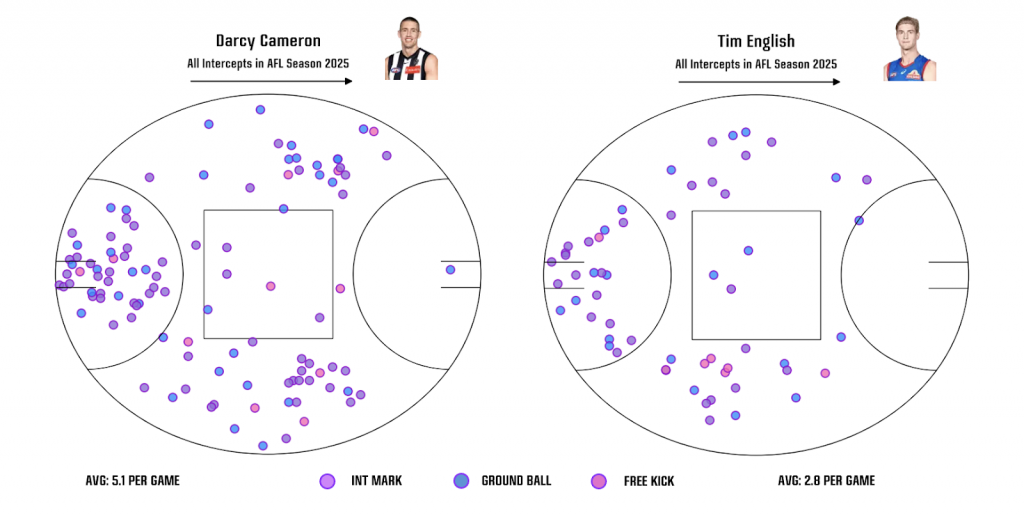
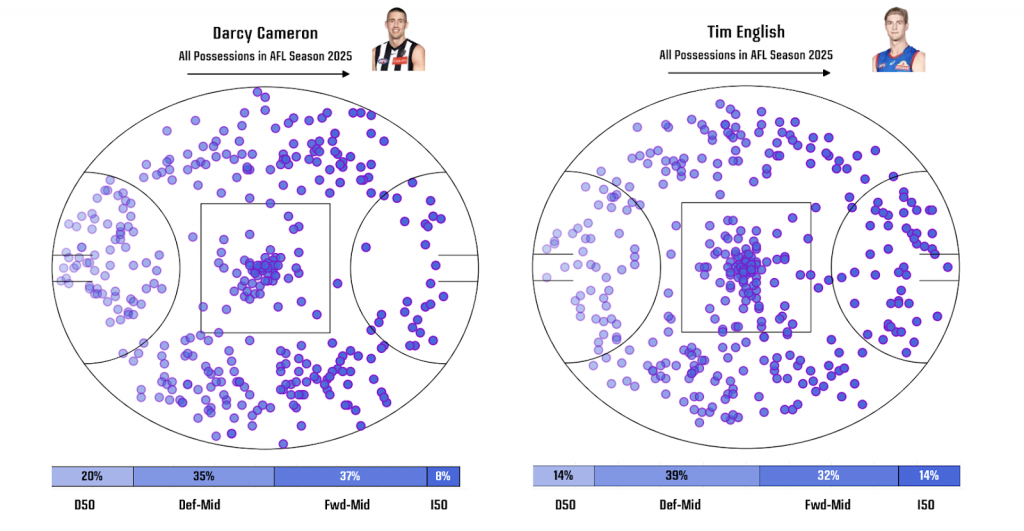
The Shifting Marking Market
Marks are a central component of the beautiful game of football. While there have been minor increases in marks per game over time, going back to 2012, the total number of marks per game have hovered between 88 through to 94 per game. Total marks have also remained quite stable as a ratio to disposals per game, shifting slightly from 24% up to around 25% post stand rule.
However, not all marks are created equal and it is important to look at different types of marks. In a game where the importance of maintaining possession and transitioning the ball quickly has exploded, the craft of getting open and providing an easy marking target out on a lead is a precious commodity that is growing in prominence this season.
With the caveat that it is extremely early, this season there is an interesting spike in the marks being taken on leads by teams. For the first time since 2014, teams are averaging more marks on leads than contested marks. This is partially because marks on leads are up to the highest they have been over the last 15 years, and partially because contested marks are at the lowest rate that they have been over the same period.
The increased speed and openness of the game could be contributing to both factors. For contested marks per game, with the ball more in motion, there are fewer instances where players are looking to put the ball into contested situations. On the flipside, there is also increased space to lead into when the ball is moving quicker, creating more opportunities for players to lead effectively.
Even so, last year contested marks were still more common than marks on the lead. St Kilda and Sydney were the only teams that took more marks on the lead than contested marks. For both teams it was more about being poor at contested marking than being leaders at marks on leads, and both teams raided Carlton to try and improve their contested marking in the offseason.
This year though the ratio of marks has flipped, and teams are taking more marks on the lead than they are taking contested marks. There are 12 teams averaging at least 10 marks on leads, a number which hasn’t been reached by a team since Collingwood did it in 2021.
Given the small sample size it’s hard to work out how much of Port Adelaide’s total up the top is due to a change in play style under Carr, and how much is due to totally dominating a poor Essendon defence this last weekend. Essendon conceded 7 marks on the lead to Mitch Georgiades alone, and is averaging 21 per game conceded to opponents.
Only two teams are getting more of the ball from contested marks than marks on the lead. Creating easier ball movement remains an issue for Carlton, who are one of the two teams continuing to get more from contested marks rather than marks on the lead. However, Sydney taking more contested marks is a bit of a surprise, given they were the worst in the competition at it in 2025.
There are a few contributing factors for Sydney. The first factor this week was the loss of Gulden and Heeney, which certainly hurt both the run and the ball movement of the Swans. The other has been the relatively low output from star recruit Charlie Curnow. Sydney recruited Curnow to help provide aerial support and fill their need for a key forward, but following on from a down year last year, he continues to be down on his peak output, with his worst marking numbers since his rookie season in 2026. Curnow might look to the man from the other end of the field last week if he wants to return to form.
Last year the renaissance of Jack Gunston was one of the more surprising stories in football. Gunston has always had a knack for finding space and working to the right areas in the forward line. But last year’s resurgence came in part off the back of leading the competition in marks taken on the lead, with Gunston being the only player to average more than 2 per game. Gunston was able to translate his ability to find space into significant scoreboard impact, trailing only Jeremy Cameron in Goals per game last season.
In the first few rounds Gunston has continued on from where he left off last season. He has been a joy to watch plying his trade in the front half of the ground, continually working himself into dangerous areas and testing the concentration of his defender. He was pivotal in the win against the Swans last week, and is once again second with 4.3 goals per game and averaging an impressive 2.7 marks on the lead per game.
Whether it is the stand rule, or just pulling insights from what worked last year for Hawthorn and Gunston, it seems teams are looking to get out on the lead more. It means that Gunston’s got a bit more company with 25 players who are averaging 2 or more marks on the lead so far. Those numbers will certainly come down as defences adapt to the increased speed that we have seen early in the season, and as Essendon’s porous defence improves from historically bad levels. However, the early numbers suggest a genuine shift in how teams are working and using space that it will be interesting to see if teams look to clamp down on in the coming weeks.
The Early Season Spike in Scoring isn’t as Big as you Think it is
Earlier this week Jon Pierik wrote an article for The Age exploring whether the AFL’s latest batch of rule changes have bought about the desired effect and led to more scoring.
“While not all teams have played three games, the bump in scoring is obvious,” Pierik wrote. “When comparing the average scores across the first three rounds of this season and last, there’s an increase of five points per team, to 90 points.”
And that’s true, if you round up.
If you compare the average team score across the first three rounds of this season compared to the first three rounds of last season (excluding the rescheduled Geelong/Brisbane and Gold Coast/Essendon games from Opening Round, as these weren’t played until Rounds 3 and 24, respectively), things have increased from 90.2 to 94.98.
(Pierik may have made a typo at the start of the article when saying the average for this season is 90 points – the figure towards the end of the story says 95.)
But when I posted about seeing this story on X, fellow TWIFer Emlyn Breese weighed in with two very valid points.
The first point was that with so few games played across the first three weeks of the season, it’s important to acknowledge that four of the six teams that have played three games (instead of two games, like the other 12 teams) are in the top five for average points scored at this point of the season.
Gold Coast (384 points, three games, average of 128 per game) have the highest average score, ahead of Hawthorn and the Western Bulldogs (339 points, three games, 113 per game), Fremantle (218 points, two games, 109 per game), and Sydney (318 points, three games, 106 per game).
The second point is that it would be better to test whether scoring (and some of the other offensive metrics) have improved on last year by taking an average of the team averages, rather than simply dividing the total number of points scored by the number of teams that have played.
Emlyn’s suggestion removes the bias of some teams playing more games than others by using an average of averages approach. This accounts for the fact that teams who have played more games will inflate the total number of points scored, which in turn will affect the overall average.
So, let’s apply the average of averages method to the original question from the start of Pierik’s article: have the AFL’s rule changes worked?
Using the latter approach, we can see that the average of each team’s points per game across the first three rounds of the season has increased from 91.86 last year to 93.40 this year – a year-on-year increase of just 1.67% (compared to the 5.22% increase seen in the former method).
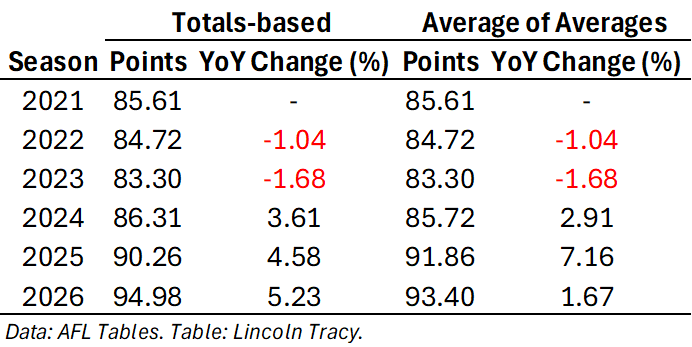
The results from 2021 to 2023 are the same for both methods because the same number of games were played across the first three rounds. The somewhat contentious introduction of Opening Round in 2024 has meant teams have played an uneven number of games until later in the season. As a result, the average of averages method is more accurate.
Inside 50s, which remained relatively consistent in Pierik’s analysis, do not change drastically using the average of averages method.
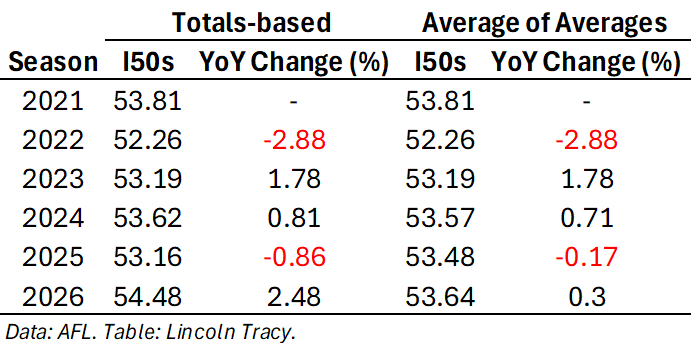
It will be interesting to check in and see how scoring changes once teams play more games and are back on level footing with respect to games played. But in the meantime, it’s more accurate to say that the spike in early season scoring isn’t as large as everyone thinks it is.
Tracking the Tracker
There’s been a lot of talk this week about the spate of hamstring injuries and whether this is due to the running loads taken on by teams. I wanted to dive into the data that is available to us at a team level and see if we can corroborate some of what has been said.
Firstly, this data is derived from the tracker found in the AFL App. It surfaces both team and individual data. Individual data however is only surfaced for the top five players for a given metric in any match. With that limitation it’s not really possible to get a proper season trend for any given player. They may run the same amount two weeks in a row, be captured in that top five one week, and be missing the next simply because five other players ran further.
It’s also important to note that there are some games where there’s clearly been a GPS error so there are some weird outliers. I haven’t had the time to go through and weed them out unfortunately.
The metrics we’ve got at our disposal are:
- Total distance covered (metres)
- Distance covered at high speed (18+ km/h) (metres)
- Number of sprints (Occasions running above 24km/h for at least 1 second)
- Number of repeat sprints (Total sprints within 60 seconds of each other)
- Average speed of movement while team is in possession of the ball (m/s)
- Average speed of movement while opposition is in possession of the ball (m/s)
For a start we’ll look at the raw figures.
We can see that across our 6 metrics things have either plateaued or slightly decreased from last year.
However, as Cody and Lincoln have each written about this week March football is not indicative of a full season. What happens if we restrict our focus and look at just games played in March?
We can see a modest increase. It’s not earth shattering, but if players are already loaded up to capacity every bit on top of that will have a greater impact.
If the metrics change substantially during a season, what does that actually look like?
We can see that pretty consistently distance covered at high speeds starts slow and peaks mid-late season. Sprints over the past three seasons have also climbed from a low base. Other metrics have a more limited variation and it’s harder to determine a trend as opposed to just noise.
Given we’re starting from a higher base it will be interesting to see if and where the high intensity metrics peak this season and what impact that has.
It’s also worth considering what these metrics actually mean for winning and losing.
The eye test tells us that for most metrics there doesn’t appear to be much of a link. This is backed up by a quick spearman correlation coefficient. This isn’t too surprising, different game styles require different running loads so the lack of strong overall trends makes sense.
The exceptions are teams that win tend to run slower on offense and faster on defense.
If we look at team by team we might be able to find some more interesting features.
Since we’re going off a smaller population size (70 – 80 per team as opposed to 800 games across the entire league) we’d need to see stronger correlations to take note of them. This is admittedly pretty rudimentary analysis, but a ballpark figure would be that we should start to take notice at above 0.25 (or below -0.25, with negative values indicating a positive differential is correlated with losing).
Sprint differentials for a number of teams start to climb into meaningful territory. Melbourne and Essendon also benefit from a high repeat sprint differential.
Brisbane’s wins are correlated with distance covered (both high speed and total) more than other teams, while Collingwood are edging a meaningful correlation to total distance covered.
A final thing we can look at is the profiles of individual teams quarter by quarter.
We should note that the running a team does is very dependent on the context of a game, but we can still note a few interesting observations (from a small sample size):
- As you would expect, across most metrics most teams workload drops off during a game – players tire out and run less or run slower.
- Fremantle’s speed on attack has risen through the game, as have Carlton and the Giants to lesser extents.
- Port Adelaide’s speed with and without the ball falls off a cliff in the second half, Carlton’s speed on defence has cratered in the third term and recovered slightly in term 4 – but still is in stark contrast to their speed attacking.
- A few teams have a secondary peak in Q3 after the long break, Adelaide and Sydney fairly pronounced in this for distance total and distance high speed.
- Carlton have the reverse of the typical profile for repeat sprints – peaking in Q2 and Q4
- Essendon and Port are done by Q4 and this is most evident in the sprint figures – averaging almost 10 fewer sprints than the next lowest team for the quarter.
Setting Up The Board
Joe Cordy / @JCordy37
Thursday night’s Hawthorn vs Sydney clash was my first opportunity to attend a live game this season, but more importantly it was my five-month-old son’s first opportunity to attend a live men’s game ever. Sat up in the fourth tier just to the south-side of the punt road end, he let the full breadth and majesty of the MCG wash over him and listened patiently while I explained how both teams set up their structures on each line to best exploit their own strengths and their opponent’s weaknesses.
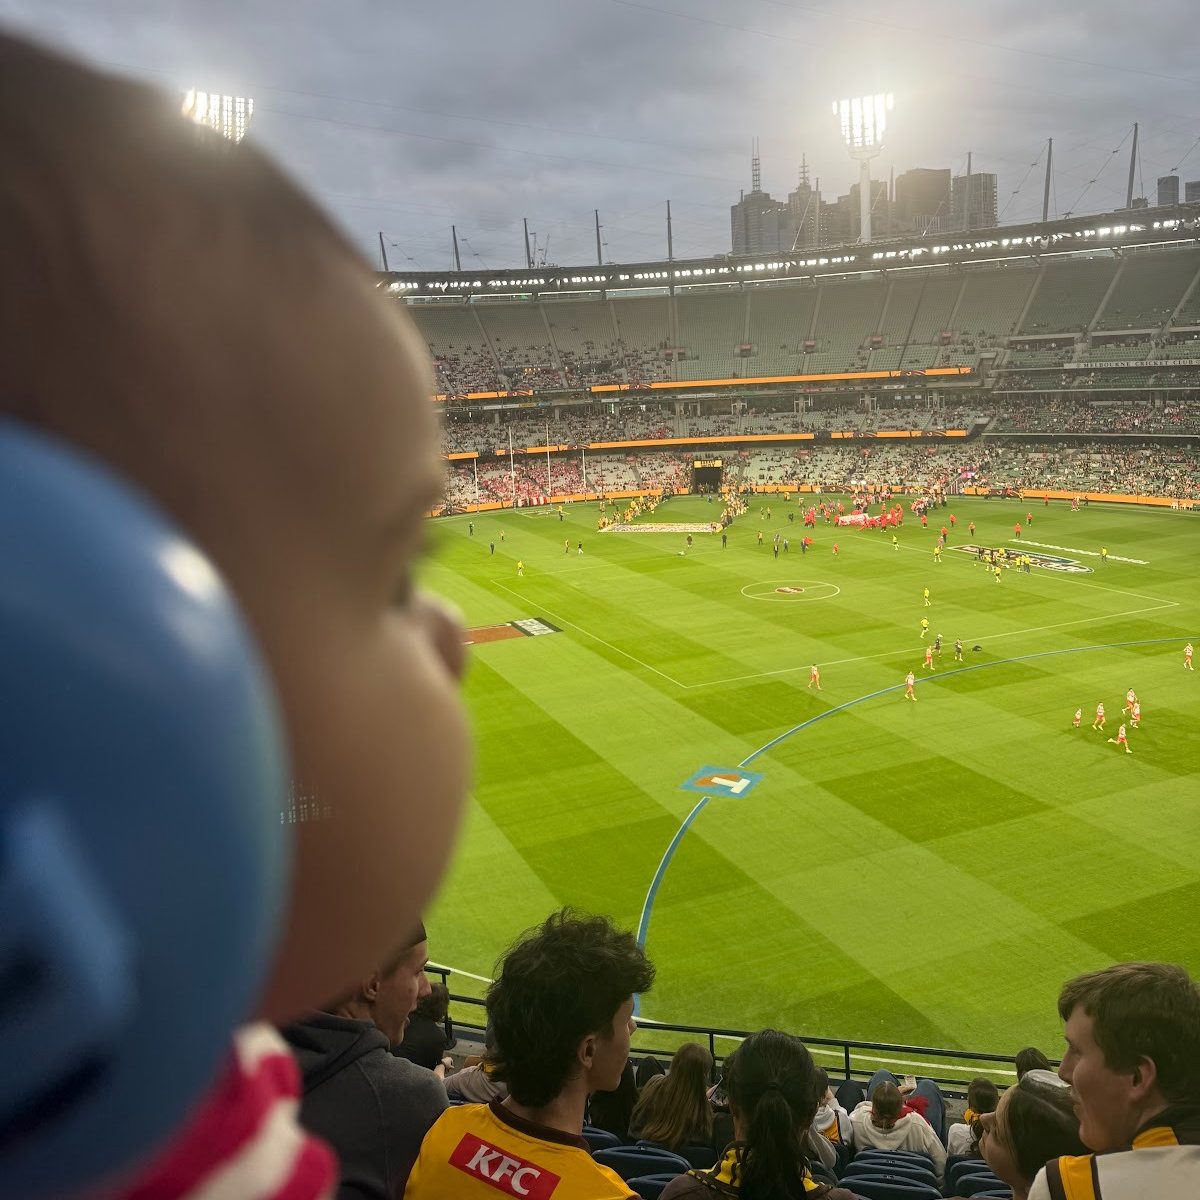
I explained to him that aside from the sense of community, the energy of the crowd and the feeling of being part of something bigger than just yourself, one of the reasons I’ll always prefer attending games live is the ability to all 36 players at once and how they’ve been organised.
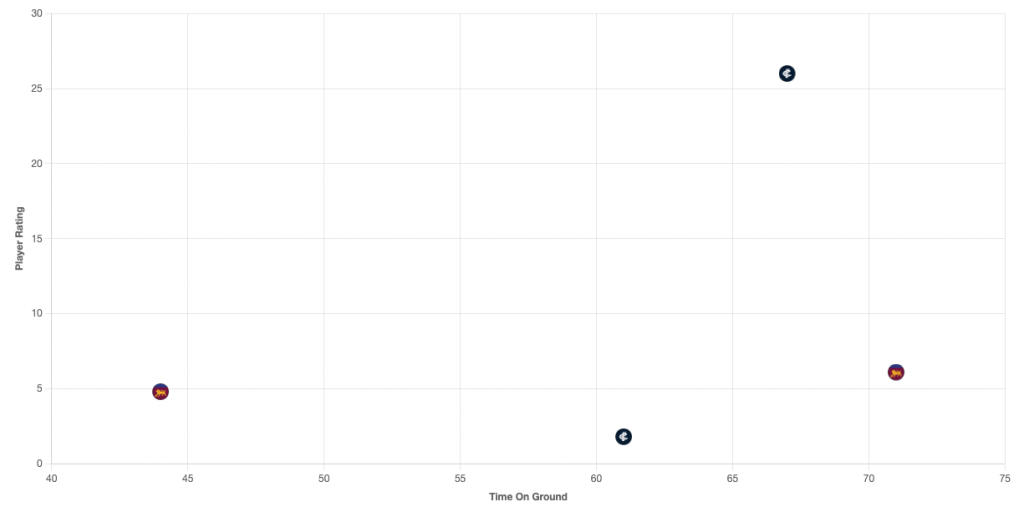
The Sydney Setup
I never completely resign myself to losing before a game’s begun but when Sarah Black confirmed Heeney’s absence, meaning the Swans would play for the first time since the end of 2020 without him or Errol Gulden in the side, I lowered my expectations. When a player is removed from the top of the talent pyramid you don’t just wipe however many potential points off the scoreboard like a tower getting shorter; the effect cascades downwards throughout the playing group. “Who can fill their roles? Who can fill the roles of the people filling their roles? Who can fill the roles of the people filling the roles of the people filling their roles?” reverberating ad nauseum throughout the list.
After a season that felt like building and repairing a plane while it’s in the air, Cox understandably opted for stability. Caiden Cleary and Corey Warner would come in to provide general forward presence and stoppage support, Justin McInerney would move closer inside the contest, but he wasn’t ready to shift other major pillars like Callum Mills on-ball from his defensive position. While nobody besides Brodie Grundy had attended more than 70% of CBAs throughout the first two games, this matchup saw a much tighter rotation of Rowbottom, Warner and McInerney all getting 70% each with nobody else attending more than a third.
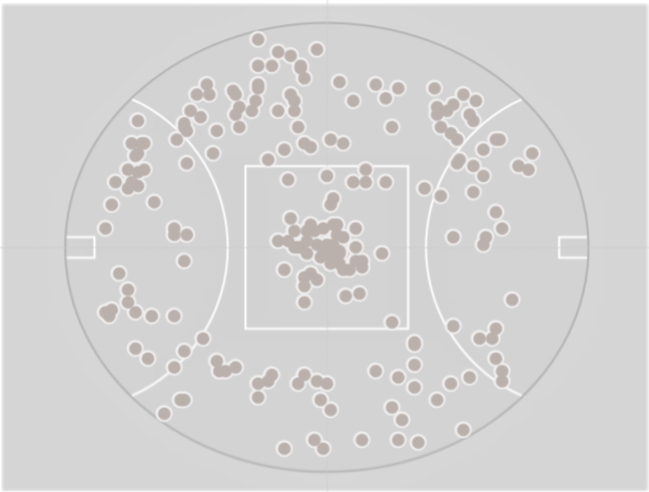
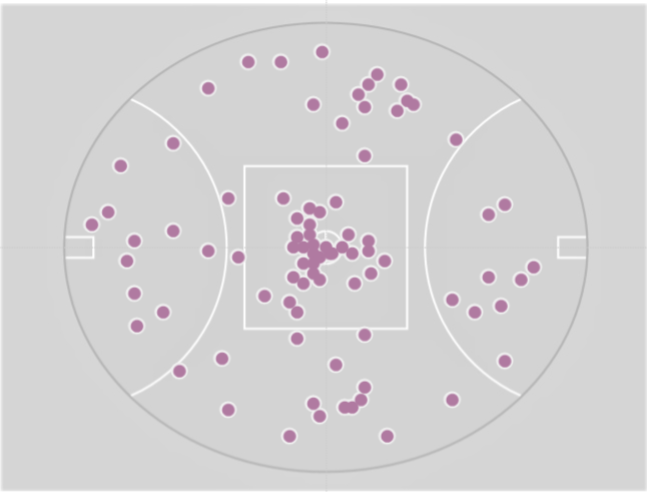
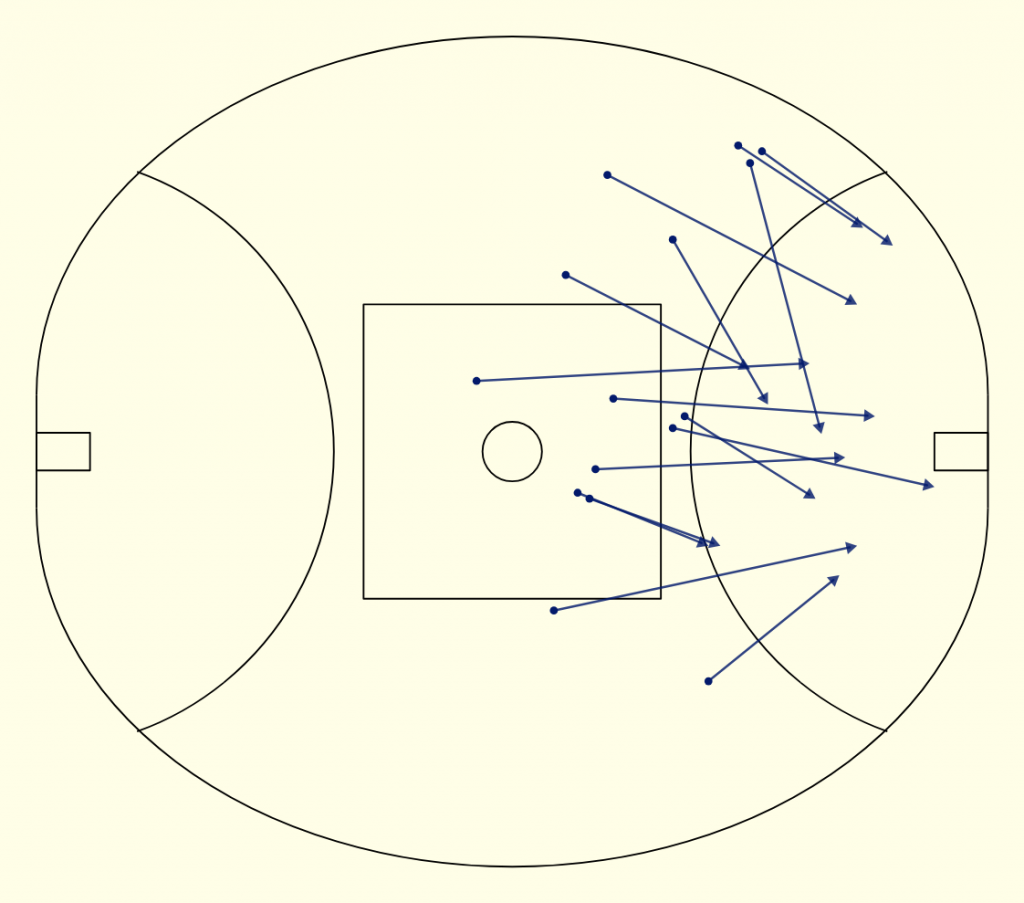
Knowing the deliveries wouldn’t be as clean or as frequent as they normally enjoy, the Swans forwards were spread in a way that tried to maximise their 1v1 capabilities. When setting up for a mid arc stoppage they’d typically form into a 1-2-1 wide diamond formation: a player one-out in the goal square (typically Curnow), a skinny side tall in the pocket ready to come in and overlap (typically McDonald), a fat side general forward playing a rest defence role to cut off the Hawks’ counter attack should they try to switch the play (typically Lloyd), and a final tall one kick out from the stoppage ready to wrestle under a floating dump kick (typically Amartey).
While this setup worked well for periods, its efficacy quickly waned as they were forced into long dump kicks that lacked the precision of Gulden, or ground-level follow up of Heeney. Many kicks came from long range and wide angles trying to find a target in the central corridor that Hawthorn quickly mopped up.
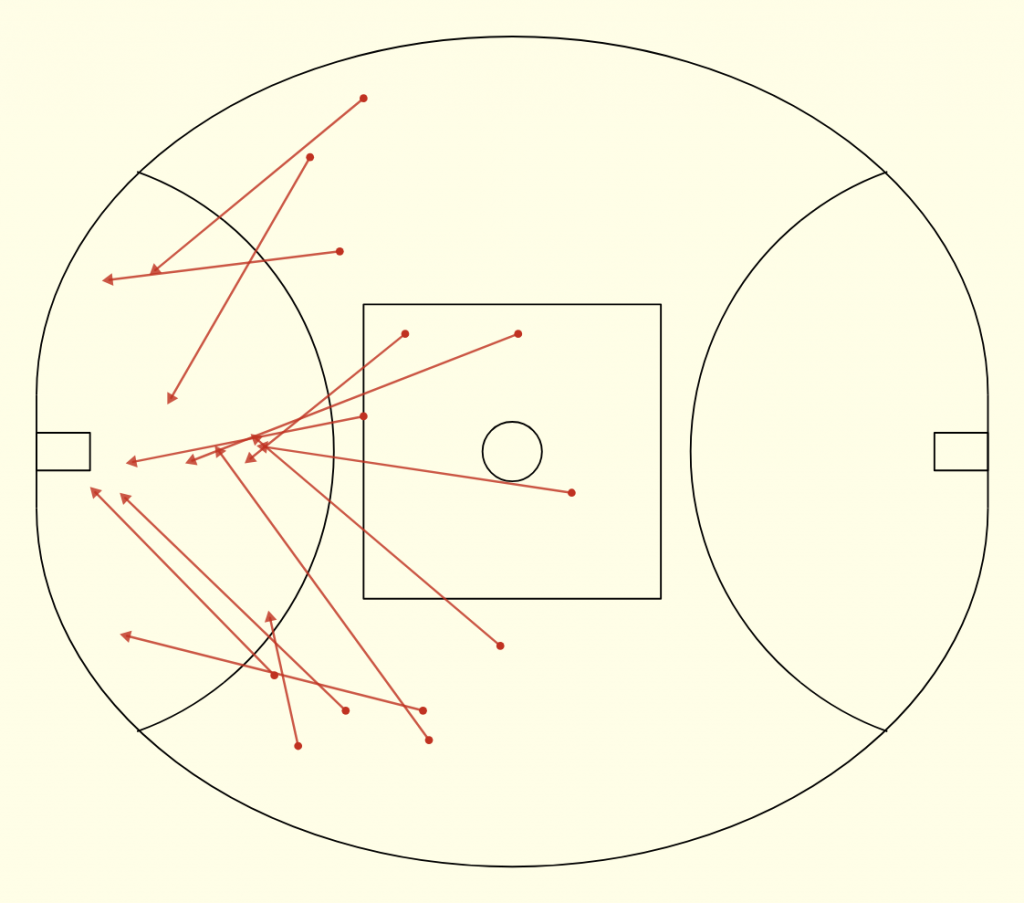
When Sydney were able to retain possession from these entries were the shorter, more controlled kicks from the corridor in instances where the talls could halve the aerial contests for players like Papley and Rosas Jnr to run onto.
While hindsight is 20/20 and most things are easier said than done, it seems clear now that what the Swans lacked was the composure to create more of these situations rather than bombing in hope.
The Hawthorn Setup
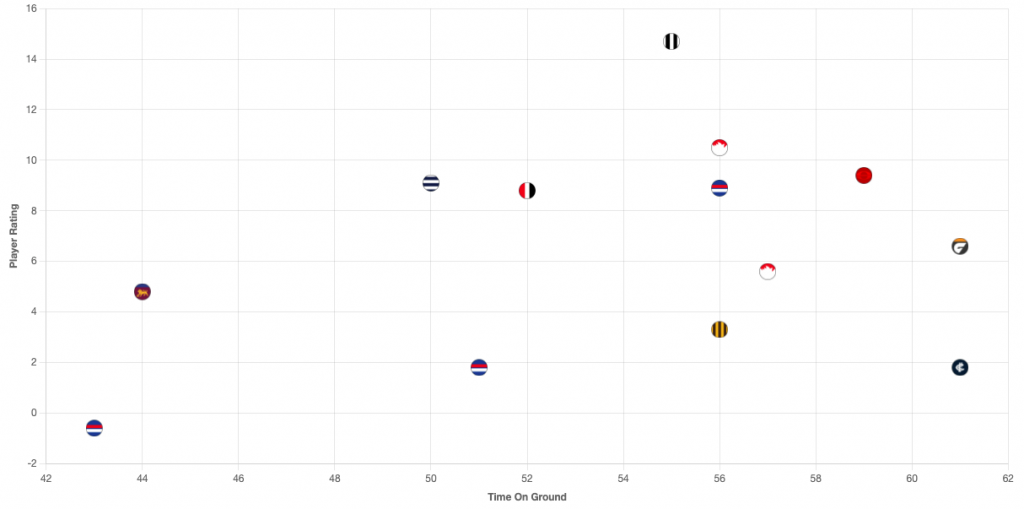
Even with their undeniable scoring power, the Hawthorn forward line isn’t one that’s typically thought of as having an overwhelming amount of tall talent. Despite this they’re currently a top four team for marks inside 50, in both the total number and relative to the amount of entries they generate.
Their ability to maximise the output of their forwards, many of whom are still young or have been moved on by other clubs, comes from a system built on emphasising their individual strengths.
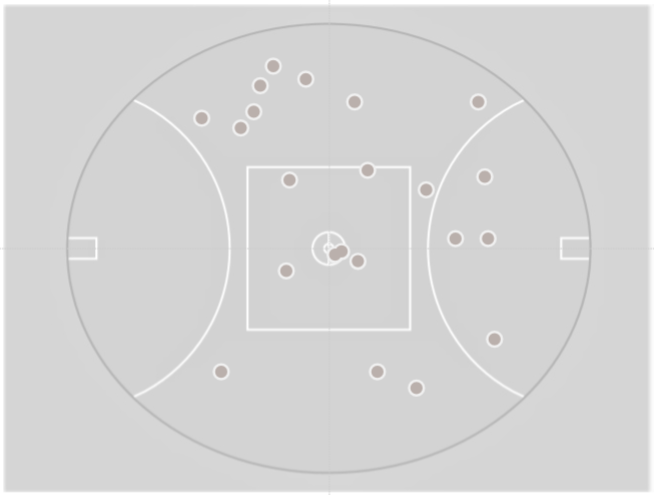
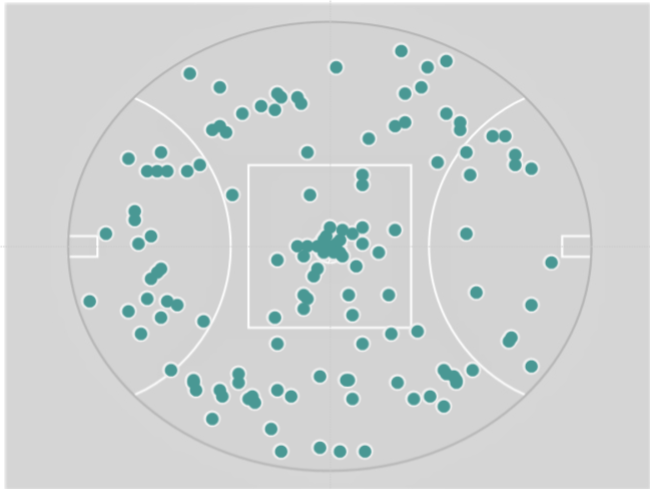
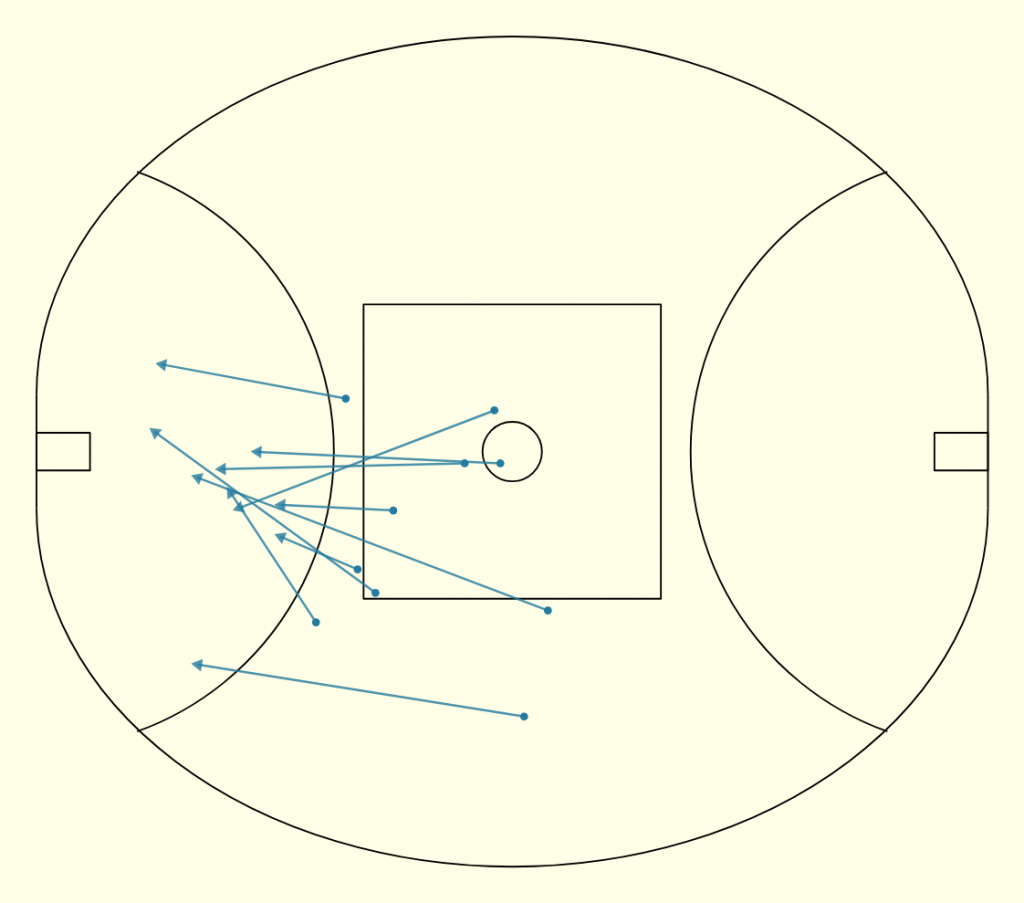
Unlike Sydney’s diamond formation with their four forwards all ready to use their size and strength, Hawthorn choose to line up in something closer to a 1-3 T-shape for mid-arc stoppages. One isolated deep tall, and then a line of three others closer to the source with acres of space behind them. Unlike a lot of other sides, including their opponents on the night, that would have their tallest target as the one out the Hawks were at their best when Mabior Chol was further up the field and Jack Gunston running out of the goal square. The Hawks rely on footspeed and beating their opponents horizontally to create uncontested marks, and deployed like this they were able to create set shot opportunities from every angle.
Even though the winning goal came from a moment of brilliance with Gunston kicking across his body at a stoppage, they were a mirror image of the Swans – at their best when creating an uncongested forward line to take marks on the lead. Cox was eventually able to clog up some of this space by conceding an extra at stoppages to let Mills wander loose in defensive 50, but without their usual on-ball talent to cover this deficiency in manpower the Hawks were able to score on volume rather than quality of entries.
This ability to spread and stretch their opponents across the entire width of the MCG is all about putting their players in positions to succeed. During his one year stay in Brisbane, Jack Gunston’s shots and goal tallies hit career lows alongside his marks on the lead; now he’s hitting career highs in what should be his twilight years. In fact, no Hawthorn player was in the top 20 for offensive 1v1 contests in 2025, but had two in the top 20 for marks inside 50 including Gunston leading the league.
Controlling the Controllables
It’s impossible to ever completely unpick exactly what parts of a team’s performance can be attributed to a coach’s tactical system, innate talent of the players or their skill execution on the day.
Sam Mitchell’s decision to move Barrass onto Curnow in the second half worked well not least of all because Tom Barrass is a brilliant player, but it was close to not having mattered because of a double swing in each team’s scoring against expectation.
While footy pedants like myself love getting into long arguments distinguishing who is each club’s best player, who’s their most important, and whether or not they’re the same person, the only two possible answers to either of those questions for Sydney were both unavailable to Dean Cox. While it’s far from a guarantee the Swans would have flipped the result had they played, it’s impossible to imagine they wouldn’t have performed better.
Coaches though are in the business of controlling the controllables. Much to their dismay players aren’t chess pieces that will be reliably available performing identical functions week in week out, and so the best coaches are the ones who can identify what’s within the range of possibilities and adapt to what their players are offering them on the day.
I don’t know if my boy fully understood any of this, but he seemed to enjoy himself all the same.
Around the Grounds
- Julia Faragher for The Overthinker on the first Vietmanese player(s) and the language we use to talk about our game
- Mateo Szlapek-Sewillo for One Percenters on the recent spate of soft tissue injuries
- Founding fathers of This Week in Football Sean Lawson & Cody Atkinson for the ABC on the rise of South-East Queensland
Want to submit something to This Week in Football? Get in touch!
If you’d like to contribute to This Week in Football feel free to get in touch via email on: ThisWeekInAustralianFootball@gmail.com