Tag: finals

  • Finals Week 1, 2025

    Finals Week 1, 2025

    This Week In Football is a collection of some of the best in football currently outside the walls of AFL clubs or broadcasters. Each week a curated grab bag from regular contributors and special guests will provide insight into and beyond the game on subjects of their choosing. For more about our contributors, click here.

    Banner images by Polly Porridge of the True Bloods Podcast. Check out her other design work.

    Before the Bounce

    After what feels like near endless football, the men’s AFL finals are finally upon us. The game has successfully made it’s way to another finals series almost untouched.

    With the exception of the introduction of a video boundary review system. In response to making 48 errors over 7,500 boundary decisions (or an error rate of 0.64%), the AFL has decided to unilaterally introduce the video review of boundary decisions in finals.

    It’s unlikely to have a significant impact on how the finals will play out, and the review may not even be used in anger through the last month. However, there is something odd about introducing new rules for the finals without prior testing inside of the season to look for secondary impacts.

    Or: why now?

    This week (and for the rest of the finals) TWIF will look at each men’s final and preview what might turn each game. Our own James Ives has created “opposition analysis” style dashboards that provide a brief overview of how each side has played through the year and how they can be beaten.

    This Week In Football we have:

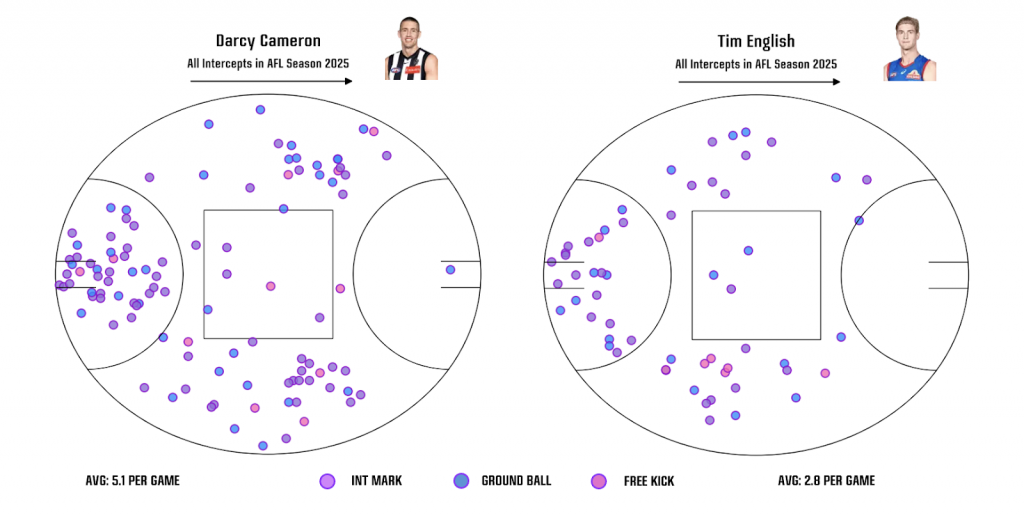
    Adelaide v Collingwood Preview

    Words – Joe Cordy . Image – James Ives.

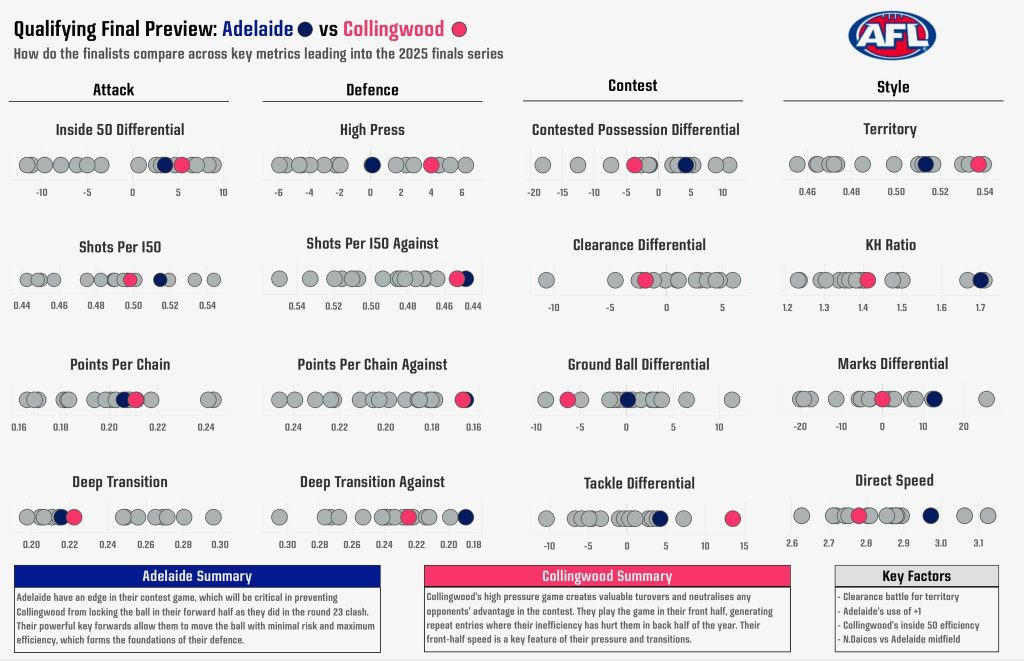
    Since the beginning of the 16-team era in 1995, there have been 15 instances of teams playing each other in the last two weeks of the Home & Away Season and then immediately again in the first week of finals. Adelaide and Collingwood’s Qualifying Final will be the first of the 2020s however, and the first time either club finds itself in such a situation since 1995. 

    While a trip away to the minor premiers is a daunting task for anyone, Collingwood will be coming into it with the knowledge that they’ve already knocked off Adelaide once, and came excruciatingly close to completing the double in a game they won the Inside-50 count by 34. If they can recreate a similar volume of entries, it becomes a straightforward task of figuring out how to take advantage of them. 

    The most obvious answer is to incorporate the 211cm Mason Cox, who’s been brought into the side following the injury to Dan McStay, but it seems unlikely the 34 year old American is still up to the level. He’s only recorded 3 or more marks twice in the 2025 season, and only neither of his two in Collingwood’s round 10 victory against Adelaide came inside-50. A much more likely route to victory for Craig Macrae’s side is spreading the space at Adelaide Oval as much as possible to create uncontested marks inside 50, getting the ball into the hands of Elliott and Membrey who are both enjoying massively accurate seasons in front of goal. 

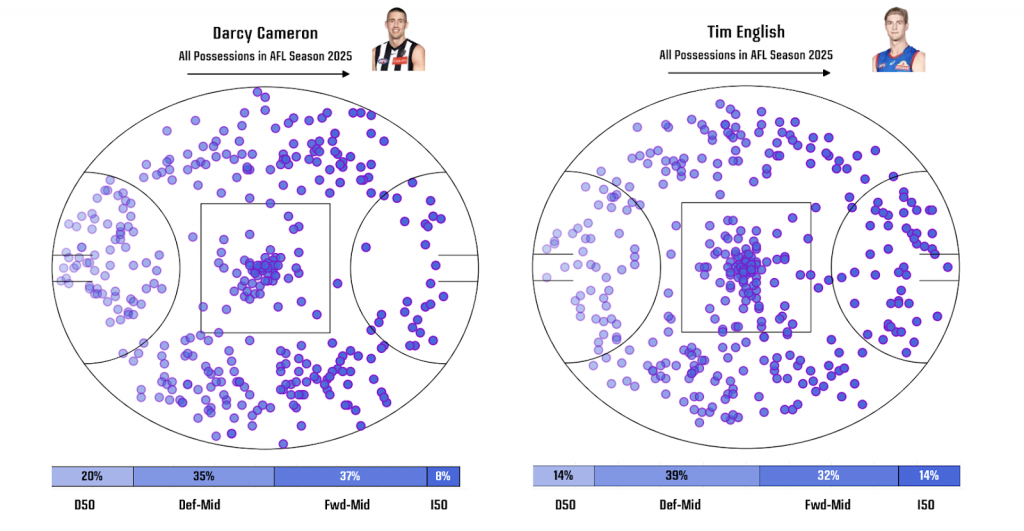
    For their opponents a much more difficult problem stands between them and a home preliminary final: how to execute their slingshot footy without Izak Rankine. A large part of what makes Adelaide so effective in games they lose the territory battle (currently sitting on a 6-3 record in 2025 when recording less inside-50s than their opponent) is their propensity to flood their D50, and then attack on the rebound with isolated tall forwards, elite kicks and sheer pace. 

    They’ll still have their pair of All Australians in Jordan Dawson and Riley Thilthorpe available in the early and finishing parts of these chains of possession, but Rankine created a connective tissue between midfield and forward areas that’s not easily replicated by others. In their first game following his suspension for using a homophobic slur, they were nearly caught out by perennial cellar dwellers North Melbourne. Even with two more weeks to recuperate and plan around Rankine’s absence, it may prove even more impactful against elite opposition.

    Neither of the two sides are coming into the clash near full health or their best form. While the deciding factor could come from one or two moments of individual brilliance from the remaining stars on either side, it seems more likely it will be found in which of the two coaching groups better adapts their gameplan to compensate for the absence of key figures. 

    Geelong v Brisbane Preview

    Words – Sean Lawson . Image – James Ives

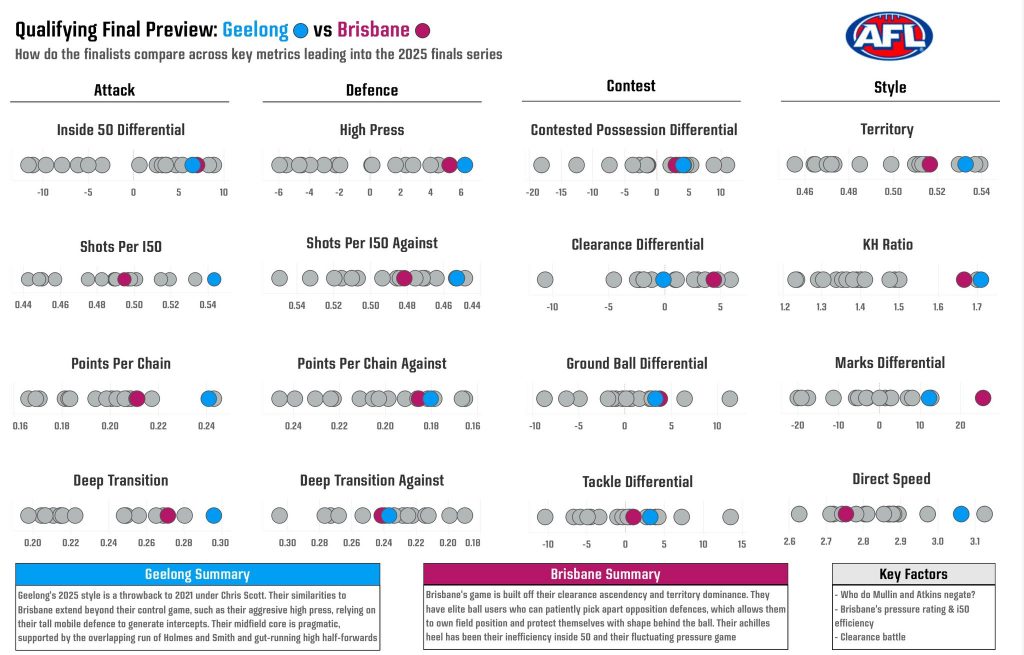
    Brisbane have already beaten Geelong twice this year, including a comprehensive defeat at Kardinia Park in June. In both games, Brisbane have been able to get their possession and marking game going, moreso than the Cats. These two teams take the highest number of marks per game in 2025, with the Cats also the best marking side inside 50.

    The difference at Kardinia was a combination of Geelong’s well below par goalkicking and Brisbane’s ability to transition on the Cats. A full third of the Lions defensive half chains went inside 50 – roughly average for the season as a whole for them, so holding up against strong opponents on their idiosyncratic home deck is a big positive.

    A fun element to watch will be the midfield matchups byplay. Last time around, Lachie Neale was relatively well curbed and the Lions found success through others, especially as they looked to make Bailey Smith accountable with a Hugh McLuggage matchup, while the Cats tried to work their defensive midfielder Mark O’Connor onto him instead.The confusion this created led to a number of solid clearance opportunities for Brisbane, and surely Geelong will have something different up their sleeve this time around.

    GWS v Hawthorn Preview

    Words – Cody Atkinson . Image – James Ives

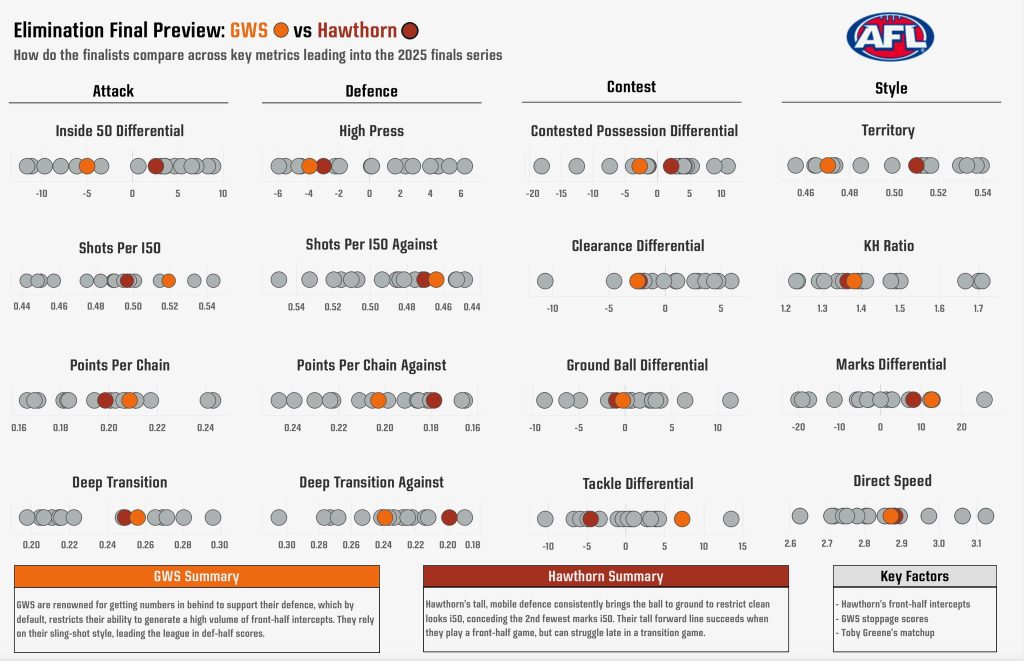
    Hawthorn and GWS might not be footballing twins, but there’s parts of each side’s game that might cause you to do a double take every now and again.

    There’s some elements that look similar. Both like to throw at least an extra behind the ball. Both sides look their best when they transition up the ground with some pace.

    Neither side focuses on winning raw numbers of clearances, instead focusing on the stoppage rebound. When both sides win the ball from stoppage, they tend to put more points on the scoreboard than most sides.

    Both sides tend to deploy a very tall set up in the forward line, boasting relatively mobile key position players that can cover pressure gaps.

    But there are some differences at play.

    Hawthorn places more pressure on the ball when they don’t have it, while GWS tends to protect valuable space and folds back a bit more readily. GWS tackles slightly more than Hawthorn, while the Hawks hold space and block escape routes for the opposition.

    The Hawks also tend to prioritise raw territory a little more than the Giants, with the Sam Taylor led backline allowing the Giants to soak up repeated entries at will.

    Both teams can occasionally look mercurial to the outside, or flaky to critics. They are both prone to putting runs of goals on the scoreboard, or allowing them going the other way. Part of this is down to both sides’ brands of footy.

    The last two times these sides played saw these intense swings. In round 4 this year GWS got out to a 35 point lead in the first quarter before Hawthorn wiped out the advantage by halftime. The Hawks held on narrowly there, but it was a close encounter.

    In round 22 last year Hawthorn took a 28 point lead into the last quarter before getting run down by an increasingly urgent Giants side.

    There might be some fireworks in this match.

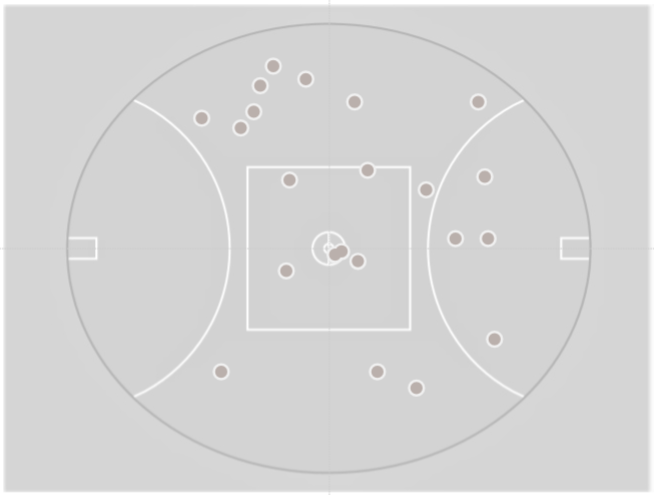
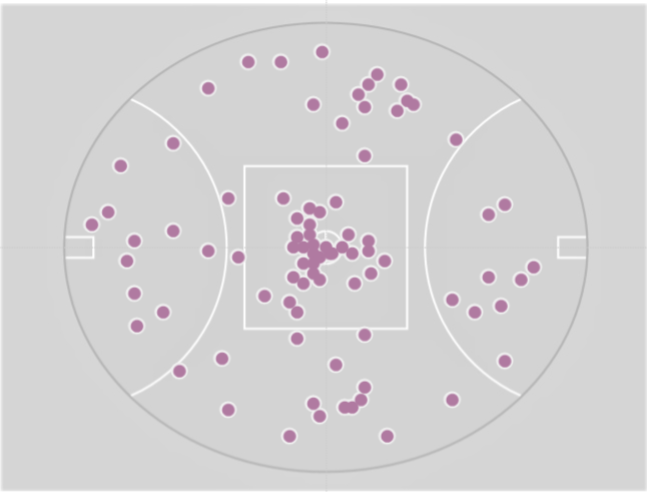
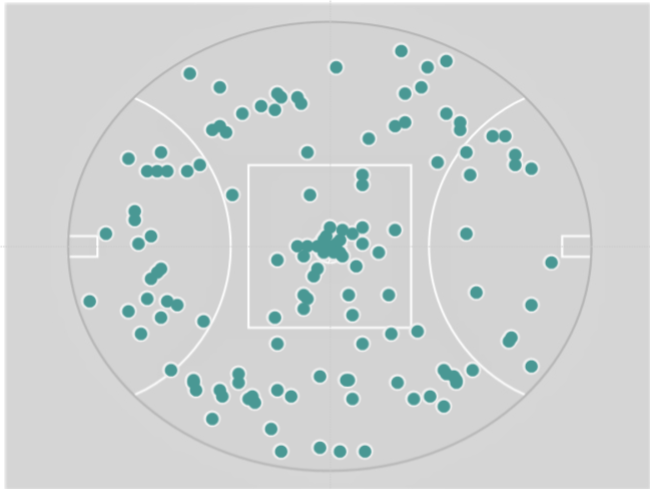
    Fremantle v GC preview

    Words – Jack Turner. Image – James Ives.

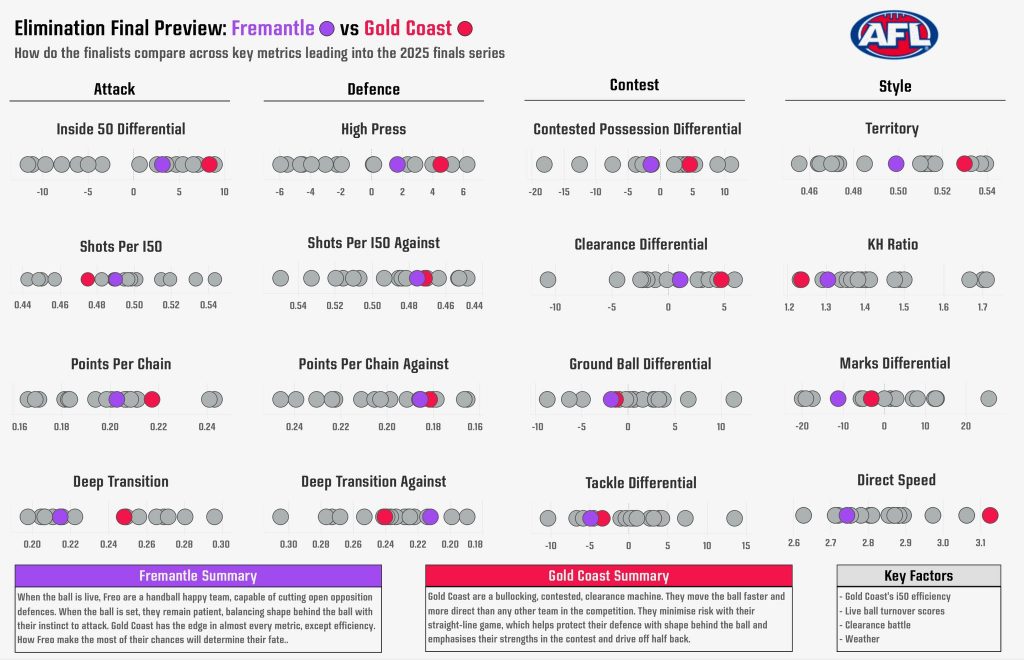
    Fremantle and Gold Coast enter the finals as the two least experienced teams and the two regarded as least likely to win the flag. Each boast a talismanic veteran and former captain who is set to retire upon their next loss. Fremantle is looking for the fairytale finish for Nat Fyfe and the Suns for David Swallow. Both men needing to at least make a preliminary final to reach 250 games before retiring.

    Fremantle have been somewhat of an enigma this year, with inspiring wins against Collingwood, the Suns, and Adelaide, countered by confusing and disheartening losses thumpings at the hands of Geelong, St Kildaand Brisbane, and an equally perplexing close away loss against Melbourne. 

    The Dockers’ best football is fast and highly skilled, utilising the outside run of Shai Bolton and Murphy Reid to create scores, the utility of Luke Jackson in their divisive two rucks setup, and their well drilled midfield group to make them the second strongest centre clearance team in the finals this year – behind only their opposition in the Suns. 

    Early in the season, the Suns looked as if they were destined to be a team that beat up on lowly opponents but couldn’t stand the heat when it came to the big boys – with the exception of a controversial win against Adelaide in Round 4 – but this proved not to be the case. They won games post bye – a time they have been historically poor – against Collingwood and Brisbane to sure up their spot in the finals, and despite a loss against an inspired Port Adelaide side in Hinkley and Boak’s farewell match Gold Coast dished out the biggest win in their club history to wrap the season, confirming their first ever finals berth.

    The last time these two teams met, Fremantle proved too strong, winning out by just 11 points in a seesawing contest in the wet, where the Suns surged back to within a goal with just minutes to go. If you’re a believer in xScore – or even someone who likes using it as a tool – then it makes this matchup even more interesting to know that Gold Coast won on xScore by four points the last time they met, with a 15 point turnaround from the actual scoreboard. 

    Keep an eye out not only for the obvious matchups between these two midfields, as names like Serong, Anderson, Brayshaw and Rowell go head to head, but also on Alex Pearce lining up on Ben King, and Sam Collins trying to outmuscle the goliath that is Patrick Voss. That may well be where this game is won and lost. Harris Andrews recently took Voss out of the game and disrupted Fremantle’s forays forward, and we saw Sam Taylor force Ben King high up the ground, ruining Gold Coast’s structure inside 50.

    Will either team go all the way? Can either retiring veteran prove to be the spark or motivation their teammates need to find that extra level? Only one team can keep the fairytale alive, and we will know which it is by 9pm AWST on Saturday night.

    The AFLW’s Scoring Boom

    Joe Cordy

    When the final siren went on Gold Coast vs Sydney, the Swans’ 103 points was the third highest score in the competition’s history, and only the fourth to reach triple digits.

    Eight days and fourteen games later, it’s not even on the podium for the 2025 season. 

    It was knocked out of the bronze spot for all-time scores on the same day by Brisbane’s 35-105 victory over Walyalup, before Yartapulti’s 108-40 game against Gold Coast and the Kangaroos’ 14-114 demolition of Walyalup each set a new gold standard less than 24 hours apart. 

    The Kangaroos’ win was so comprehensive they set three other scoring records: the longest single game goal-streak in AFLW history (15), the highest margin in league history, and the first game to ever record a 100-point margin.

    These four games are part of a wider trend of increased scoring across the AFLW. The league has gone through several massively impactful transformations in its first nine seasons, both planned and unplanned, but despite some volatile year to year variance scoring per game has generally trended upwards.

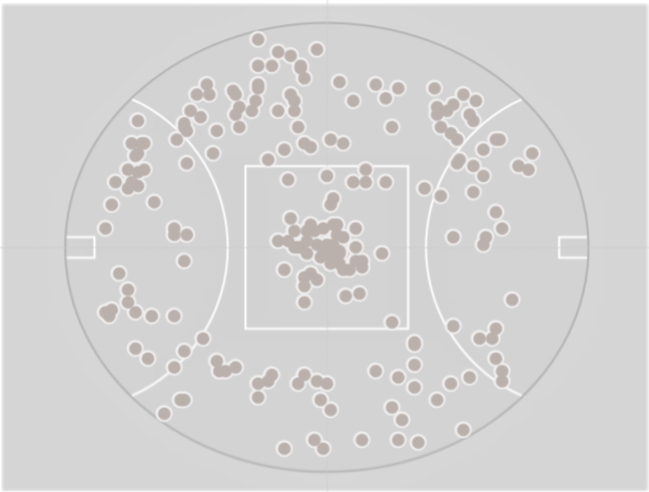
    While the lack of location data prior to the 2025 season precludes anyone making an xScore model for the AFLW, a rough approximation of it from points per shot shows that accuracy has remained reasonably stable across the league’s lifetime, typically hovering just under three points per shot.

    The bigger indicator in the rise of scoring has come from volume, rather than quality or execution, of looks at the goal.

    The 2025 average of 14.5 per game is over a whole shot higher than the previous high watermark set in 2023, and thus far six of the eight highest volume shooting teams in league history have all come about this season.

    While this is obviously going to regress back towards the mean as the sample size grows and the good teams play more against each other than bottom of the ladder opposition, it does match the eye test of the dangerous teams looking more co-ordinated than ever. 

    Gemma Bastiani on Deep Dive broke down how Sydney work as one to create space, thinking two and three disposals ahead in the chain to support each other and pull apart opposition defences. It’s a level of tactical sophistication and cohesion that’s only been able to be achieved with significantly longer pre-seasons and contact hours with the club, which itself is downwind of salaries making footy viable as a full-time career. 

    In 2023 the AFLPA signed the first ever joint Collective Bargaining Agreement (CBA) between the players of the men’s and women’s competitions. The joint bargaining power led to a breadth of changes for the AFLW, but the most important was the staggering increase in guaranteed payments for each player. 

    The AFLW doesn’t have a salary cap, instead opting for a tiered structure where clubs can offer two Tier 1 contracts, six Tier 2 and Tier 3 contracts, and sixteen Tier 4 contracts. Until 2022, the Tier 4 contracts that made up the bulk of any club’s list were below the tax-free threshold in Australia. Immediately following the joint CBA, Tier 4 contracts became worth more than Tier 1 contracts the year before by over $14,000.

    While this was still only marginally above minimum wage for full-time work in 2023, 2025 has seen a significant jump within the five-year lifespan of the CBA. Tier 4 contracts are now competitive with starting salaries in most industries, and Tier 1 contracts for each club’s best and brightest have now reached six figures for the first time. 

    Unsurprisingly, giving all players enough financial security to focus on footy as a full-time profession has given them a strong base to build off for the season, and their newfound fitness and preparation time as groups has created the best footy the competition’s ever seen.

    The Race to 100 AFLW Goals

    Emlyn Breese / CreditToDuBois.com

    We’re in the tenth season of the AFLW and there’s a solid chance this is the season we see someone break the 100 career goals barrier.

    The increase in scoring, as Joe talks about above, has lead to individual players kicking more goals.

    There are four players who, if they maintain their current 2025 goals average for the rest of the season would hit 100 goals before finals.

    We should place an asterisk on Jasmine Garner though, as she’s set to miss two to three weeks through injury so would need to pick up a couple of goals when she returns.

    How did we get here?

    There have been a total of 8 players who have held the careers goals record at some point, either jointly or by themselves. From Lauren Arnell sharing it for three minutes in game 1 of season 1, to Darcy Vescio holding it a combined three and a half years.

    It is a seriously accomplished list. Darcy Vescio, Erin Phillips, Tayla Harris, and Jasmine Garner are among the most recognizable players in the competition’s history. 

    Kate Hore is a club captain, premiership player, and three-time All Australian. Danielle Ponter was a key part of Adelaide’s 2019 and 2022 premierships, while Jess Wuetschner is one of the most dangerous small forwards the league has seen. 

    Lauren Arnell isn’t notable as a goalkicker but is a premiership player, three-time all Australian, and the first AFLW player to go from playing in the league to coaching in it.

    Here’s the progression of those eight players goalkicking tallies – goal by goal, minute by minute.

    There’s also some worth in seeing who had the goalkicking title and for how long.

    If there was a favourite right now for who’s going to get to 100 goals first, Kate Hore seems like an easy choice. Whoever it is it will be a moment for the whole competition to celebrate.

  • Pre-finals Bye and AFLW Round 3 2025

    Pre-finals Bye and AFLW Round 3 2025

    This Week In Football is a collection of some of the best in football currently outside the walls of AFL clubs or broadcasters. Each week a curated grab bag from regular contributors and special guests will provide insight into and beyond the game on subjects of their choosing. For more about our contributors, click here.

    Banner images by Polly Porridge of the True Bloods Podcast. Check out her other design work.

    Before the Bounce

    Finally, a break.

    For the last 24 weeks there has been end to end men’s football. This is the last pause in that competition before the race for finals heats up.

    This is the last moment of calm before the storm, before the stakes get raised.

    Meanwhile, the AFLW season hits starts to hit full stride with clear air for the league to bathe in. The footy is good – probably better than it ever has been before. If you’ve got a hankering for footy, get to a game this weekend (or flick on the TV).

    This week in football we have:


    The TWIF MVP

    Adrian Polykandrites | fromthetopdeck.com | @fromthe_topdeck 

    The home-and-away season is done and dusted, which means it’s both finals time, and awards season. 

    On Thursday night, Nick Daicos was named MVP by his peers, while Noah Anderson and Bailey Smith were joint winners of the coaches award. In a few weeks the league will crown another Brownlow medallist (or multiple). There’s also a bunch of awards handed out by some of the major media companies that cover the game.

    And while they all carry a certain level of prestige, they’re also a bit eye of the beholder in terms of how much they mean.

    While it’s ingrained in footy to use weekly votes to decide most of those awards, there’s the inherent problem that not all best-on-ground performances are created equal, but the votes don’t know that and can’t distinguish.

    When done well, the best awards serve as something of a time capsule. They (should) tell us who mattered most in any given season.

    The This Week In Football gang has had a crack at determining who that should be for 2025. 

    Following NBA MVP voting rules, each voter named their five best players for the season. The top player received 10 points, seven points for second, five for third, three for fourth and one for fifth.

    Without further ado …

    13th – 1 vote: Matt Rowell, Sam Taylor and Max Gawn

    Three very different players each received one fifth-placed vote. 

    Emlyn Breese said of Gawn: “There are few players I’ve ever seen who have the capacity to shape a game and do so regularly as Gawn still does.”

    While James Ives thought the GWS key back was worthy: “By far the best interceptor in the competition. And while GWS get a high volume of numbers back to support, I’m not sure they can get away with their style of play without Taylor.”

    12th – 2 votes: Caleb Serong

    “It’s almost a 15-way toss up at this point. You can make a good argument for Pickett, Taylor, Green and less convincing but still solid for another dozen. Serong has been impressive, shook tags and stood up when it’s mattered most for a success-struck side.” – Cody Atkinson

    11th – 3 votes: Luke Jackson

    Ryan Buckland had the Fremantle big man fourth on his ballot: “Can’t help but think without his versatility and skill the Dockers would not be in the position they are in. Underrated aspect to his game: he allows Fremantle to play Sean Darcy as a pure ruck which allows ~him~ to be the best he can be.”

    10th – 5 votes: Kysaiah Pickett

    Joe Cordy gave the Demon his third-place vote for a “Career season as the best mid-forward in the game, keeping his level while the team falls apart around him.”

    Ninth – 6 votes: Bailey Smith

    The new Cat and now coaches award winner received fourth-place votes from two contributors.

    The Back Pocket’s Jack Turner was one of them: “Has genuinely transformed Geelong’s midfield and run.”

    Seventh – 7 votes: Sam Darcy and Nasiah Wanganeen-Milera

    Two players from the 2021 draft who had breakout seasons, with Wanganeen-Milera earning his first All Australian blazer on Thursday night.

    The Saint featured on three ballots with Emlyn Breese voting him third – “I think he’s the model of what you want in a footballer right now.” – and two other voters placing him fifth. 

    James had Darcy second on his ballot: “His contested marking is unparalleled. You only have to look at Naughton’s numbers with and without Darcy to see his impact. Nullifying Darcy goes a long way to nullifying the Dogs.”

    Sixth – 15 votes: Harris Andrews

    James thought the Brisbane key defender worthy of maximum votes: “He’s the best two-way key defender in the competition and his ball use is severely underrated and critical to what Brisbane do.”

    Fifth – 20 votes: Nick Daicos

    I had Daicos fourth on my ballot – he’s the beating heart of a top-four side – while two others had him third. Ryan, however, had him as the season’s second most valuable player: “ Even in probably his most disappointing year to date … Daicos still managed to be the electrical rhythm that reanimated an otherwise corpse-like Collingwood side.”

    Fourth – 29 votes: Noah Anderson

    I was one of three voters to have the Suns’ skipper third on my ballot. He’s one of the most complete players in footy. 

    “It still feels like he doesn’t get talked about enough for how good he is,” said Emlyn, who had Anderson second. 

    Third – 30 votes: Jeremy Cameron

    I had the Geelong superstar second. The Cats are stacked, but Cameron raises their ceiling more than any other player on their list. He’s the biggest reason they’re the team to beat over the next month.

    Cody had Cameron first – “The most important player in probably the most complete team. Was asked to do far more than his position suggests. Didn’t miss a game which also helps.” – as did Joe.

    Second – 49 votes: Jordan Dawson

    I was one of two voters to have Dawson at the top of my ballot. The Adelaide skipper made a habit of stepping up in big moments in leading the Crows to the minor premiership. There might be only one onballer more well-rounded. 

    Mateo Szlapek-Sewillo had Dawson second, but had similar praise: “He’s the captain (and best player) for the side that just completed the largest single-season rise up the ladder in AFL history. Consistently produces his best football in the most important moments.”

    First – 58 votes: Marcus Bontempelli

    The Dogs’ skipper will be watching the finals, but that didn’t stop four voters putting him at the top of their ballot. I had Bontempelli fifth, while only one voter left him off entirely.

    Voters were similarly aligned as to why the seven-time All Australian should get top votes, but Ryan perhaps summed it up best: “This guy is still so obviously the only answer to the question of, ‘If you could pick any player in the league for your team, who would you pick?’ There’s a gulf between him and the rest.”


    Who was the biggest All Australian snub?

    Jack Turner | The Back Pocket | TheBackPocketAU

    While we are only at the squad stage at the moment, there are already some players who fans are shocked to see have been left out. But who were the biggest snubs from this squad of 44 – 22 of whom are set to receive new or updated blazers tonight.

    Of the 44 player squad, 28 have never made an All Australian team, meaning at least 10 players will receive an All Australian blazer for the first time. Some of the more surprising players to miss out are also yet to receive an All Australian selection.

    While there are cases to be made for nearly a dozen players to be very unlucky, we’ve narrowed it down to three big misses. For any stats referenced below, they will include only players who have played 16 or more games, as this seems to be the unofficial cutoff point for All Australian selection guidelines.

    Callum Wilkie – St Kilda

    Callum Wilkie received his first and only All Australian blazer in 2023, and was arguably unlucky to miss out on both squad and team last year. In both 2023 and 2024, Wilkie was supported down back by Josh Battle, who left as a free agent to play at Hawthorn this season, and was instead supported by the much less seasoned – though still serviceable – Anthony Caminiti.

    Amongst eligible key defenders, Callum Wilkie has the third highest Player Rating, the second most Coaches Votes, and of players averaging 2+ Contested Defensive 1v1s he has the 7th best record. He is behind only Harris Andrews for kicking retention rating amongst key defenders, and inside the top 10 for threat rating amongst the same group. He has also taken more marks than any player in the competition in 2025.

    There are only two players averaging 15 disposals, have a less than 25% CDOOO loss rate (2+ avg) and have received 30+ coaches votes in 2025. One is Callum Wilkie. The other is his former teammate and 2025 AA squad member Josh Battle.

    Oliver Dempsey – Geelong

    This one is a little more complicated than the other two I’m going to write about here, because there is a fair argument to be made that Dempsey clearly has not been in the best 40 players in the AFL this season. But I think it’s also fair to say that players like Lachie Ash, Sam Collins and Josh Worrell wouldn’t fit that criteria either, and have been selected based on their position.

    And this is where we face the All Australian team’s biggest issue in recent years head on; the All Australian team simply refuses to pick genuine wings in the team, and this year that seems to be true for the squad. Not a single midfielder in the team has a Centre Bounce Attendance percentage of less than 50% – with the exception of Wanganeen-Milera, who was used as a half-back for much of the year. The main candidates are outside midfielders such as Bailey Smith, Finn Callaghan or Nick Daicos, but none of these players are wings; they are centre bounce specialists. Rovers and receivers.

    Of players listed as a midfielder who have attended less than 25% off their team’s CBA’s, Ollie Dempsey has the second highest Player Rating, the most goals, the third highest contested possessions, the most score involvements, the third highest goal assists and has the fourth highest threat rating per kick.

    Football is a much more complicated game than it once was, but with the introduction of the 6-6-6 rule, and available starting position and matchup data; it should be easy enough for selectors to add players to the squad from a list of genuine wingers.

    Aaron Naughton – Western Bulldogs

    I have saved perhaps the most egregious snub – and maybe the one I am most baffled by – until last. Many are quick to point out that Aaron Naughton started the season off slowly from a goals perspective, but he was still averaging 6.5 score involvements across his first ten games – a figure that would see him in the top 10 key forwards had it continued for the whole season.

    Another critique is that his form improved once Sam Darcy came back from injury, but I think it’s fair to say that most key forwards clearly struggle without a genuine foil, including the others who have been nominated this year.

    Over the season, Aaron Naughton amassed an impressive 60 goals – especially impressive as he had Sam Darcy in there with him kick 48 in the same year – finishing fourth in the Coleman medal, just two goals behind third. He finished behind only Jeremy Cameron and Mitch Georgiades for marks inside 50 and behind only Jeremy Cameron for score involvements by a key forward – finishing 8th overall in this stat.

    Furthermore, of the players who kicked more than 50 goals this season, he led the way for the most score involvements that weren’t from a shot on goal that he took, bringing his teammates into the game just as often as scoring himself.

    The full list of players with 50 goals and 150 score involvements in 2025 is as follows: Jeremy Cameron, Aaron Naughton, Riley Thilthorpe, Jack Gunston.


    The AFLW meta shaping up

    Emlyn Breese / CreditToDuBois.com

    Note: this article is published during AFLW indigenous round. I have used the names six teams have adopted for the duration of the round. You can read more about indigenous round and those teams here: https://www.afl.com.au/aflw/indigenous/clubs

    As a Narrm (Melbourne) supporter it should surprise no-one that I have been absolutely hanging out for the Women’s season. It’s still obviously really early, so the focus will mostly be on the teams that appear to be separating from the pack two rounds in.

    As per last week, I’m still building a lot of this data gathering infrastructure as I go, so I’ll have more time to dive into what it tells us as that settles in later in the season.

    First I wanted to build upon my very brief look at scoring shots in AFLW last week.

    Sydney and Melbourne have very similar profiles for where their scores are being generated and conceded – big positive turnover differentials, and a healthy stoppage differential.

    Essendon share a similar, but lesser, turnover differential but they’ve actually got a negative differential on stoppage scoring shots.

    Where it gets really interesting though is the Kangaroos. Of their 33 scores they’ve generated 28 of them from turnover, 2 from centre bounces, and just 3 from other stoppages. More broadly, they’re actually in the negative for clearance differential (-0.5 per game). This is a stark difference to the other undefeated sides who make up the 4 best clearance differentials range from +10 (Hawthorn) to +4.5 (Sydney).

    Where the Roos are leading the competition is generating turnovers (1st at +9/game) and uncontested possessions.

    The Kangaroos have had 55.5 more uncontested possessions per game than their opponents, with Sydney and Narrm inches behind at +55. The next best is Brisbane a massive step back with 19.5. To me there’s a clear meta forming around uncontested possession, and I think success will be driven by harnessing or countering it.

    For Narrm this is something of a return to past success. In their flag-winning season 7 campaign they recorded twice the uncontested possession differential of the next best team.

    Even among the three leaders there are significant differences though. Sydney and North are finding a lot more uncontested marks, each about 20% above the league average. They’re also two of the top three teams for retaining uncontested possession from a kick (the third being Kuwarna (Adelaide)). Narrm by comparison find themselves in the bottom 6 for kick retention.

    Accordingly, Narrm are below league average in uncontested marks, despite leading the league in possession differential. Where Narrm do stand out is their handball use and pressure. 46% of the Demon’s disposals are by hand, compared to a league average of 39%. Sydney are at league average while the Roos are slightly below.  Their handball receives are 15% above the next best (Sydney) and 50% above the league average.

    Narrm are also leading the league for opposition disposals per tackle. With the stricter interpretation on holding the ball, a combination of quick hands to release and tackling pressure on the opposition bodes well for them.

    One other thing I found in my travels leads me to giving a shout out to Georgie Cleaver. Waalitj Marawar (West Coast) have some real problems structurally, conceding a mark inside 50 from 36% of their opponent’s entries. But, they’ve had 17 defensive one-on-ones and are yet to lose one. This is led by Cleaver who is 0 from 7. If they can sort out some of the structures they’ve potentially got an elite pillar to build around and she’s only 20.


    Estimating score assists

    Andrew Whelan / WheeloRatings.com

    Following on from last week’s article on score involvements and score launches, this article will explore score assists.

    While there’s no publicly available data on score assists, I wanted to investigate if they could be estimated using available data on goal assists. As score assists include goal assists, we only need to estimate behind assists.

    Firstly, here is the definition from the Champion Data glossary:

    • Score assist: Creating a score by getting the ball to a teammate either via a disposal, knock-on, ground kick or hitout, or by winning a free kick before the advantage is paid to the goal scorer.

    The definition makes no mention of disposal effectiveness or the intent of the player getting the ball to their teammate. Champion Data provides an example on their FAQs page which tells us that if the player’s intent was a shot at goal but the kick fell short and went to a teammate who scored, this would be treated as an ineffective kick and would not be counted as a score assist.

    As such, the definition only tells us that a score assist is limited to disposals, knock-ons, hitouts, and free kicks, but doesn’t provide enough detail about the specific circumstances that result in an assist being credited.

    What does the data on goal assists tell us?

    Using data on goal assists since the start of 2021, we can determine how often a goal assist is credited based on how the goalscorer gained possession and the effectiveness of the prior disposal.

    If we were to credit an assist for all goals above the line and none below, we would be correct for ~94% of goals. This gives us a reasonably reliable methodology for estimating behind assists, which we can combine with actual goal assists to estimate total score assists.

    Score assist analysis

    Hugh McCluggage leads the competition with 54 score assists this season, with a clear lead over Brad Close, Ed Richards and Marcus Bontempelli. Richards leads the goal assists with his teammates kicking 35 goals and only eight behinds from his assists. In contrast, McCluggage’s teammates have kicked 22 goals and 32 behinds from his assists, with all three of his score assists on Sunday being behinds.

    McCluggage is approaching Gryan Miers’ 61 score assists in 2023 with at least two finals to come. This was mentioned on the ESPN Footy Podcast a few weeks ago, and Champion Data’s count of score assists for McCluggage this season and Miers in 2023 were consistent with these estimated counts.

    Here are all players with 30+ score assists in a season since 2021.

    Jeremy Cameron and Brad Close have combined for the most scores (52) over the last five seasons, with Close assisting Cameron for 40 scores and Cameron reciprocating 13 times. Aaron Naughton (39) and Marcus Bontempelli (12) have combined for 51 scores.

    Aaron Naughton (12) and Ed Richards (2) have combined for the most scores this season, closely followed by Jeremy Cameron (12) and Brad Close (1), and Jeremy Cameron (11) and Shaun Mannagh (2).


    More on the best and worst sport cities

    This week for the ABC Cody and I ran a piece looking over the terrible sporting history of the booming city of Gold Coast. As a spoiler, the Suns did indeed break their finals drought with a win over Essendon, which means they slightly improved the city’s nation-worst record of elite men’s football teams making finals in just 13% of the seasons they compete in (it’s now 15%).

    Using all the data compiled for that article – namely finals rates reached by teams based on each city since 1987 – here’s a look comparing cities more broadly.

    First up the Central Coast turns out to be the most successful sporting city in pure percentage terms. That’s thanks to the very successful Mariners winning three championships and making finals most of the time,

    The Mariners are just one regional success story in Australia, with most regional cities other than Gold Coast have at least one club making fans happy. These include the Cats in Geelong, the Sunshine Coast Lightning, the JackJumpers in Hobart, the Illawarra Hawks in Wollongong, and WNBL teams the Fire and Spirit in Townsville and Bendigo respectively.

    Among the “big 5” cities, it’s Adelaide just barely ahead of Brisbane as the top sporting city.

    Here’s a breakdown of the win rates for teams in each city with at least ten seasons under their belt, showing how Adelaide’s all-round selection of decent teams makes them a solid showing in nearly any sport.

    Some of the most successful teams in the country of course lead their cities’ records, including the Sydney FC women’s team, the Melbourne Storm, and of course the frankly astonishing success (missing finals once in 4 decades) of the Wildcats.

    When it comes to the title of best major sporting city, though, individual dominant teams like the Wildcats just don’t quite compensate for struggles in other sports out west, like soccer, rugby, and Dockering.

    Adelaide performs well comparatively in women’s sport, too, which leads us to another breakdown of these records:

    Looking at cities by gender, we can see that mostly due to the Titans women, Gold Coast is faring notably better in women’s sport than in men’s. It may be too soon to say for sure, but there’s incipient signs that the Gold Coast sporting curse may be a single gender affair.

    The city of Geelong have had the best record of success in men’s sport, much more because of the regular Cats of the AFL than the Supercats of the NBL.

    Among the big 5 cities, Perth is lagging in women’s sport performance, perhaps a result of the tyranny of distance impacting harder in the generally less well funded and resourced world of women’s sport.

    Perhaps surprisingly, Canberra is the city with the largest negative gap between women’s and men’s clubs performance, with Canberra indeed having the second lowest women’s sport success rate after Newcastle.

    On the surface this is surprising, given that Canberra is a progressive city with a strong record of supporting women’s sport. Indeed, Canberra is the only multi-team city which has hosted more seasons of elite women’s sport than men’s.

    Many of those numerous women’s seasons are of course the reason for the gap, however. Teams like the Capitals (9 titles) and Canberra United (2 titles) have great legacies of success as standalone teams in cities without men’s counterparts in their sport. However, both have also spent extended periods missing finals in between golden periods.

    Canberra also, for several decades, hosted a mostly forgotten second WNBL team, the Australian Institute of Sport, which was a development side made up of youngsters and basically only made finals when Lauren Jackson was leading them to a title.

    Around the Grounds

    • Marnie Vinall reports for ABC on what Mitch Brown’s announcement means to queer fans.
    • It is very funny that the AFL Coaches Association awarded a “best young player” award to a 28-year old.
    • On Sarah Burt and Georgie Parker’s podcast AFLW Weekly, Georgie worries for the way AFLW salaries, newly outpacing Super Netball pay, are beginning to lure star players across and hurt a well established traditional sport.

  • Round 24, 2025

    Round 24, 2025

    This Week In Football is a collection of some of the best in football currently outside the walls of AFL clubs or broadcasters. Each week a curated grab bag from regular contributors and special guests will provide insight into and beyond the game on subjects of their choosing. For more about our contributors, click here.

    Banner images by Polly Porridge of the True Bloods Podcast. Check out her other design work.

    Before the Bounce

    This upcoming round is about to see the maximum amount of elite footy played in one week in the modern football era.

    Nineteen games of elite football will take place in a seven day period out to Wednesday’s makeup game between the Suns and Essendon. With the compressed 2020 Covid season not reaching such levels, the last time top level footy saw so much action was probably in the state league era when three states saw top level footy at once.

    It all gets a bit difficult to keep track of, particularly as the AFLM and AFLW continue to exist, despite some level of web and app integration, in somewhat parallel media and fixturing spaces. Look up what games are on when, and chances are you’ll only see half of them listed.

    Luckily, friend of TWIF Polly Porridge has done something the AFL should have already done via its official app. Polly has put together a match listing for all of the weekend’s games with all AFLW and AFLM starting times with all games listed chronologically (all times AEST):

    It’s a whole lot of footy – fifteen games in two days – for everyone.

    Hope you are ready for Peak Football.

    This Week in Football we have:

    Breaking down score involvements and score launches

    Andrew Whelan / WheeloRatings.com

    For my first TWIF article I will explore score involvements and score launches. What are they and who are the leaders this season?

    Here are the definitions from the Champion Data glossary:

    • Score involvement: Number of scoring chains where a player was involved with either a disposal, hitout-to-advantage, kick-in or knock-on. If a player has two disposals in the same scoring chain, he is credited with one score involvement.
    • Score launch: Scoring chains launched by an intercept possession, free kick, hitout-to-advantage or clearance.
    • Scoring chain: Includes all disposals and possessions for the scoring side that occur between the score launch and the actual score. The chain can only be broken by either the opposition gaining possession of the ball or a stoppage.

    Working back from the score itself, the scoring chain begins at the most recent stoppage, kick-in or when the scoring team last gained possession from the opposition. Only a stoppage or a change in possession breaks the chain – a spoil from the opposition does not break the chain, nor does an ineffective disposal from the scoring team if possession is retained.

    For scoring chains that start with a kick-in or an intercept possession, the score launch will be credited to the player taking the kick-in or winning the intercept possession (which may be a free kick). For scoring chains starting with a stoppage, if there’s a hitout to advantage AND no opposition player took possession of the ball pre-clearance, the hitout to advantage will be the score launch, otherwise it will be the player winning possession pre-clearance and starting a chain of unbroken possession.

    Scores, score assists and (most) score launches are included in the count of score involvements.

    Interesting side note – if a scoring chain starts with a free kick and a teammate takes the advantage, the player winning the free kick gets a score launch but does not get credited a score involvement unless they have another involvement later in the chain.

    One correction I would make to the score involvement definition is changing the second sentence to “if a player has multiple involvements in the same scoring chain, he is credited with one score involvement.” A player with a hitout-to-advantage and a disposal in the same chain is only credited with one score involvement.

    To provide a visual example of scoring chains, the following chart shows all Adelaide’s score involvements against Collingwood in Round 23. Each point represents a disposal, hitout-to-advantage, kick-in, knock-on or spoil, in chains resulting in a score. The tooltip for each data point provides additional detail of their specific involvement.

    Here is a summary of all non-score score involvements by type of involvement since the start of 2021.

    And here are the types of involvements launching scoring chains.

    Who’s leading the score involvements this season?

    Ed Richards and Nick Daicos are first and second in total score involvements this season with a similar breakdown of score launches, score assists, scores, and other score involvements. Next is Jeremy Cameron with two thirds of his score involvements being his own score. Rounding out the top five is Hugh McCluggage, who leads the league in score assists, and Christian Petracca, who’s number one in the AFL for average score involvements since 2021.

    Score assists have been estimated and will be the subject of a future article.

    What about score launches?

    Max Gawn is leading the way in score launches averaging a career high 4.27 per game – the second highest season average since 2012, behind Todd Goldstein in 2015. Witts and Xerri aren’t far behind, averaging 4.15 and 4.05 per game, respectively. Max has launched 17 scores from intercept possessions this season, 32 from hitouts to advantage, and 45 from winning possession pre-clearance.

    Here are the leaders this season.


    Diving into the first week of 2025 AFLW

    Emlyn Breese / CreditToDuBois.com

    With the first week of AFLW in the books it’s worth spending some time looking at what we can get out of the early data available.

    I’ve started off by trying to identify score sources. This is relatively easy to get for the Men’s competition, but faces some extra challenges in the Women’s. This is still a work in progress, so take with a grain of salt. Because the sources are new, there’s no prior year comparison available.

    Overall we can see scores from kick-in even more negligible in AFLW than AFLM, and we also see a bigger prevalence of scores from turnover.

    Let’s now look at it on a game-by-game basis:

    Port are the only team to have scored a goal from kick in, with Katelyn Pope’s last quarter goal.

    Essendon and Melbourne had the most scoring events from turnover, while the Sydney v Richmond match saw both teams scoring as many times from stoppage as from turnover.


    Winning the ball by degrees

    Cody Atkinson

    All teams want to do two things as much as humanly possible. 

    1. Win the ball
    2. Score

    If you’ve got the ball you can score, and the other team can’t. And – spoiler alert – if you score more than the opposition you win.

    Someone get me on the line to eighteen different clubs, this is groundbreaking stuff.

    But not all won ball is the same. Some is won hard, and some is loose. Some leads to territory gains, others are turned over right away. Importantly – and linking to point 2 above – some ground ball wins lead to actual scores.

    This year Tom Green has won more ball on the ground than any other player. He’s averaging 10.1 ground ball gets per game. If you break it down further, 3.4 of those are classified as “hard ball gets” and the remaining 6.7 as loose ball gets.

    This is where on the ground he has won them this year.

    Green follows the ball – and the contest – around the ground. While there’s an expected cluster in the middle, there’s also a fair bit of action on all four corners of the deck. Note – the ground shape is normalised for the dimensions of the MCG – hence some of the boundary issues.

    If you break it down by scores generated by ground ball wins, something interesting emerges.

    That big cluster in the middle all but disappears. The Giants have struggled to turn Green’s inside ball into points from the middle, despite everything they’ve tried. The Giants are firmly mid-pack for points from stoppages and points differential from that source. That means a lot of Green’s work either hasn’t gotten teammates into space, or the chain of control has broken down towards goal. It’s been a longstanding issue for Adam Kingsley, and one that he needs to resolve to get the most out of the best ballwinner in the league.

    As mentioned above, there are two broad types of ball to be won. The first requires physical pressure and contact. This year, no player has won more hard ball than Tom Liberatore.

    Like Green, Libba follows the ball around the ground when it comes to rest. The second generation Dog has an even more pronounced cluster in the middle, but has a heavy lean to the defensive side of the centre square. That hints to his positioning at centre bounce – at the defensive sweeper side. That job is difficult, and requires balancing winning ball and preventing opposition sides from sweeping through the contest. Few can manage that balance well – let alone winning so much ball themselves.

    Most ground balls are classified as loose balls however. They happen at stoppages, but also often occur in general circumstances around the ground. This year two-time Brownlow Medalist Lachie Neale is leading the way.

    Neale’s loose ball wins are less focused on the middle. It’s a testament to his endurance ability and skill in reading where the play is likely to unfold. Neale has a nose for the ball, and to predicting where it will go before it gets there.

    No matter if it’s hard or loose, straight from a ruck tap or occuring in the middle of a transition chain, every team needs good ball winners. Green, Liberatore and Neale have been the best three this year. All three are reasons that their sides are firmly in the race for September glory.


    How does Nasiah Wanganeen-Milera’s reported contract value stack up?

    Sean Lawson

    With reports saying Nasiah Wanganeen-Milera has just become the first player to earn $2 million in a single season, it’s a great time to try to put that into context and see how it compares to the big contracts of years gone by.

    AFL contract reporting is a very nebulous activity. Reporting around individual player contracts is often vague, misleading, and subject to spin by reporting parties.

    We do know a few things for sure – the salary cap value, the minimum pay for draftees, the rough spread of player contracts.

    We know as of last year the typical club senior list would have been structured roughly as below, with an average of two players on over $1 million a year. This figure is very likely to rise to at least three per team on average in 2026.

    We know that, on average, the top three players might earn about 20% of the salary cap, and the top 6 players around one third of the salary cap.

    We also know that cap keeps going up:

    The salary cap is roughly double what it was in 2012, triple what it was in 2004, and just much larger than the 1990s. The cap growth has outpaced inflation and, in the case of some long deals, even left players behind as the cap grew around them. The AFL-AFLPA CBA has a ratchet clause for insertion in standard player contracts, but league sources indicate that insertion is not universal across the board.

    That leaves the unknowns. Even when news reports appear to carry fairly specific contract values for a player, often this number will be under or over what they actually earn:

    • Agents have incentive to inflate contract values to bolster their percieved effectiveness.
    • Clubs have incentives to hide money or to deflate figures to keep other players happier.
    • The press like round numbers, and sensationalised reporting presenting upwardly rounded multi year payments as a single number.
    • Some contracts have guaranteed and non-guaranteed money, with bonuses based on honours earned or game benchmarks.

    For historical contracts, extra payments outside the cap are obviously a difficult to identify factor. The Anthony Koutoufides contract reported in 2003 of $4m over 5 years turns out according to his agent at the time to have also involved 750k in under the table payments.

    Warwick Capper’s Brisbane Bears deal, already massive, was supplemented by valuable gifts from Christopher Skase such as a $200k vase and a clothing shop.

    So there’s a lot of caveats here, and now we can plough ahead, remembering all this should be taken with many grains of salt:

    As it turns out, Wanganeen-Milera’s two year contract at the Saintswill be roughly on par with the payment of Lance Franklin and Dustin Martin in terms of cap hit in the first year of the deal.

    Both of those were much longer deals with the amount of money managed across 9 and 7 years respectively, during which times the cap increased. At times both of those players may have been forming a smaller or larger share of the cap.

    For Wanganeen-Milera and the Saints, the cap hit is shorter term, which means less flexibility to spread the cap hit, but much more for the Saints to manage other cap space and recruitment.

    One player filling 10% of the salary cap may not be especially unreasonable considering we know that the top 3 players at the average club might get 20% and the top 6 might get over a third. The Saints have reportedly used salary cap banking in previous years to open up space for their current recruiting decisions, and the ability to defer other longer contracts into the future also exists.

    But make no mistake, the AFL’s (probably) first two million dollar man is being paid handsomely for his universally acclaimed talents, on par with a couple of the 2010s’ biggest superstars relative to the salary cap of the day.

    Around the Grounds

    • Gemma Bastiani on the W Show makes the case for recording an inside-30 stat for AFLW after the Crows showcased a lot of deep ineffective inside-50s in their surprise loss to the Saints.
    • Marnie Vinall’s ABC article about the impact of homophobia in sport is essential reading in light of the current situation.

  • Round 23, 2025

    Round 23, 2025

    This Week In Football is a collection of some of the best in football currently outside the walls of AFL clubs or broadcasters. Each week a curated grab bag from regular contributors and special guests will provide insight into and beyond the game on subjects of their choosing. For more about our contributors, click here.

    Banner images by Polly Porridge of the True Bloods Podcast. Check out her other design work.

    Before the Bounce

    There’s hype, then there’s this.

    Friend of TWIF Len Phillips found one of the weirder articles written on a AFL club website in recent years. Here’s a sample of it:

    TWIF can’t link you to the whole article because it has been nuked from the Lions website this morning. It is a wild ride of alleged bias and player acclamation. Luckily, it has been archived here.

    The article is somewhat emblematic of the race for AFL awards at the end of the year. In order to win many of the major panel-decided awards, clubs develop packs of support for nominated players. It’s arms length, but to best support the interests of fans and their players, clubs have to do a job in selling the strengths of each player.

    But that article is beyond that – a few steps past that line.

    Peter Blucher wrote that article, and one with a very similar tone about the snubbing of Harris Andrews from the All Australian team.

    That name may sound familiar to diehard, slightly older footy fans. The AFL Queensland Hall of Famer has had a long involvement in the game, from journalist to club media manager and finally player agent.

    It’s that last stop that was the one that drew the most public attention. In 2013 Blucher was suspended for a year for his involvement in the Kurt Tippett scandal, which caused Tippett to be suspended for half a season as well.

    That case was the linchpin on a crackdown on the behaviour of agents as well, although the actual face used for the crackdown was that of Ricky Nixon.

    It also wasn’t the last time his behaviour was questioned. In 2015 GWS asked for an investigation into his conduct relating to a hip operation on Adam Treloar around the time he was traded to Collingwood.

    A few years on, The Age’s Daniel Cherny broke the story around the alleged reasons around Joel Wilkinson’s failed return to the AFL. Blucher also features prominently in that one.

    This is all somewhat a distraction from the real issue – namely whether Ashcroft is in the mix for the Rising Star. Time will tell if that blank website can sway the voting panel.

    This week in football we have:


    How each AFLW side has been constructed

    Emlyn Breese / CreditToDuBois.com

    With Season 10 of the AFLW launching this week I wanted to have a look at how the 18 squads for 2025 have come together.

    There are 22 players still with their original Season 1 clubs, and each of the founding clubs has at least one original player – Adelaide having the most with 5.

    Carlton have made the most new additions for Season 10 with 10 new players – only one of whom comes from a previous club (Tara Bohana having played 31 games for Gold Coast).

    Brisbane have made the fewest changes with just three additions to their list – Neasa Dooley, Lilly Baker, and Claudia Wright all new to the AFLW.

    Melbourne have the most homegrown talent with 27, while Richmond and Essendon have the most players with prior club experience at 17.

    Essendon and Carlton both enter the season with 10 players yet to play a game for the club (Sophie McKay, Poppie Scholz, and Tara Bohana all played in the opening match of the season, so Carlton are already down to 7 uncapped players).


    AFLW State(s) of Origin

    Sean Lawson

    This is not an article about state of origin football, but rather a bit of a chart dump about where the current players in the two AFL leagues come from.

    So to start with, here’s how that looks. Thanks to Emlyn for supplying AFLW data to which I applied states of origin, while the AFLM data is slightly edited state of origin data from Fanfooty

    The most notable difference between the two leagues is that Queensland is, pretty simply, not a development state in the women’s game. There’s almost as many Queenslanders as Western Australians in the AFLW, buut there’s nerly 4 times as many Western Australians in the men’s league. 

    Queensland is not a part of the “Allies” at the girls’ under 18s championships but competes solo, finishing second in the standings this year.

    NSW and the ACT are also relatively better represented in the women’s game, which is in line with higher participation rates in adult women’s footy in the northern states.

    Western Australia’s relative lag is interesting here, and this may paint a picture of a relatively struggling women’s game out west. I noted with interest an interview with Canberran Swans player Lexi Hamilton, who described their recent star Western Australian recruit Zippy Fish as “raw” in coming from Perth instead of the development pathways in Victoria.

    The stronger women’s presence in NSW is especially the visible with regards to players from the north of the Barassi Line. A majority of male NSW AFL players (27 of 44) are from the south and west of the state, in line with the traditional strength of the Riverina and Murray regions and centres like Albury and Wagga. 

    By contrast, a large majority of NSW women in the AFLW (30 of 38) are from Sydney, or otherwise coastal or northern NSW. Riverina women’s football has been less developed until recently compared to, say, AFL Canberra, and most current AFLW players from southern NSW were recruited through intermediary periods playing in Canberra or Sydney.

    Unsurprisingly, the big states who play lots of football produce the most players, and when we convert over to per capita terms, the usual suspects predominate.

    Northern and southern NSW are shown separately here to give an indication of that traditional productivity below the Barassi line, where the Murray region is every bit as productive in men’s footy as Victoria itself.

    Also notable here is Ireland, not a state of Australia, because the roughly 7 million people in Ireland currently have produced the same number of current AFLW players (38) as the similarly sized New South Wales.

    With such a lopsided talent balance across the country, one of the big points of difference for clubs is how many locally recruited players they have. 

    Overall, AFLW squads are generally from closer to home, which is a product of the state-based drafting across the history of the league until last season, where clubs often could not recruit interstate players at all. The lower payscale and short contract periods also made making long distance moves less feasible until very recently when pay (now 60k to 100k in four tiers) started to get into “living wage” territory.

    Only three clubs – Hawthorn, Essendon and Geelong, have a more local squad in the men’s competition than the women’s and the Hawks stand out for having the highest percentage of Victorian players in both the AFLW and the M.

    In line with Queensland’s much stronger women’s footy presence, the situation for Brisbane is completely inverted between the two teams, with one of the highest local content factors on its women’s team and one of the lowest in the men’s.

    In the AFLM, every Victorian club has more locally recruited players than every non-Victorian club, and the four clubs in NSW and Queensland all found over 70% of their playing lists in other states.

    On the AFLW side, North have the most international players, but with a strong Irish contingent taking professional opportunities on our shores, only four clubs lack any overseas players at all.

    Essendon has the most Tasmanians right now, with the likes of Ellyse Gamble and Daria Bannister probably on the phonecall list for the Devils in a couple of years.

    Away from their home states, Port Adelaide is a hotspot for Western Australians like Gemma Houghton and Abbey Dowrick, St Kilda has a contingent of Queenslanders including Jesse Wardlaw, and Richmond has a number of NSW/ACT players

    In the AFLM, both Carlton and Collingwood have lots of South Australians and the Dees, Dogs and Kangaroos all have 8 Western Australians. The Crows, partly with their Broken Hill connection, have the most NSW players away from Sydney.

    Finally, on the types of players recruited from different states, it turns out clubs are more interested in scrounging up talls from non-traditional markets such as Queensland, with over a fifth of all Queensland players being of the two metre variety, compared to 11% in the league as a whole.

    Men over 200cm tall are exceptionally rare and sought after by all sports. The AFL has pursued entire pathways in US college sport just to source more meat for the ruck grinder. 

    Oddly enough, South Australia has 17 men over 2m tall playing in the AFL compared to the larger Western Australia having just 11. TWIF’s own Joe Cordy has proffered the theory that the constantly successful Perth Wildcats are monopolising Western Australia’s limited supply of tall buggers, leaving the AFL coming up a bit short, and I am not going to argue with this assessment.


    King’s working forward in different ways

    Cody Atkinson

    There’s been a bit of a debate occurring through different parts of the footy community, particularly the one existing online and in talkback spaces. It centres around Ben King and what makes a forward valuable.

    Firstly, a tweet in minimal context (and a shout out to ESPN and what they do in the footy space – this isn’t intended as criticism or shade, just an example).

    This is indicative of the thinking – if a forward like King is just getting shots on goal and providing nothing else by foot, is he doing enough to be considered valuable. Are Gold Coast getting enough off a player as dynamic as King if all he is doing is getting shots on goal?

    This hits at an issue that Sean Lawson and I have explored in part before, but in relatively disparate ways – the lack of homogeneity of jobs across the ground, and the hidden parts that make players valuable.

    In short, not all tall forwards in a team are asked to play the same role, and not all tall forwards across the league are tasked to do the same thing. 

    In fact, it’s a question that we’ve asked AFL coaches over the past five years. Almost universally, it’s not goals or marks that matter the most, but instead playing the team role and competing. Here’s Dean Cox explaining what’s important from earlier this year:

    No – the competing part and getting the ball to ground (is the most important). So say a player takes two or three contested marks in a game – it’s a pretty good game you know. But the difference between not losing them or at least having them is really important because we want you to get the ball to ground. 

    “You want to be dangerous in the air and at ground level. The forwards are aware that it’s not just about their contested marks they take, it’s about how many times the opposition take it on us and we don’t get an opportunity to get inside and score from that.

    Without being in the huddle with Hardwick, there’s a fair indication that the job being asked of King is very different to that of other key forwards. Hardwick’s teams, whether yellow and black or red and red, have tended to anchor players deep to stretch defences.

    As footy has evolved it has become increasingly congested – vertical spacing forces defences to either leave dangerous players unattended or leave room for dashing runs and leads. Richmond used to isolate Martin, Riewoldt and Lynch, while King and Long seem to be the main options on the Coast so far.

    This chart shows the top 20 goalkickers this year in terms of total marks and the average distance from goal that their marks were taken. You’ll note that King is almost 30m per mark closer to goal than a player like Riley Thilthorpe. It’s a similar story when you break it down by contested marks too – King does his work deep, as he is asked. He’s also been one of the best talls at winning ground balls inside 50 – of that list of 20, only Jack Higgins has won more per game.

    He’s also one of the most clearly targeted inside 50 this year. Only Mitch Georgiades has been targeted more in total (noting potential issues with the data). When they’ve kicked it towards King when going inside 50, the Suns have been able to rack up 326 points – the most of any respective forward/team relationship in the league. This has come at the cost of raw efficiency, but sometimes there’s a place for raw volume as well.

    King is doing those little things right – maintaining space, providing a contest, preventing rebounds. Beyond his actual goal totals, he’s providing that focal point necessary for the Suns to start actually climbing up the ladder. We know that King can play higher up the ground and contribute more, as he’s done it before. But that’s (likely) not the job in front of him right now.

    The shift appears to have worked for the Suns. They’ve gone from having the second worst rate of generating scoring shots per inside 50 to ninth in the league. They’ve also gone from being one of the worst sides at allowing sides to march from their defensive 50 to attacking 50 to one of the better teams. The Suns are also generating the deepest contested marks of any side on average of any team, providing a clear indication of how they try to attack the field and protect on the way back.

    So let’s loop back to the question above – is King doing enough? The natural reaction might be no. But given how much better the Suns have been going forward (and the role he has played) the answer is likely yes. 

    More precisely, due to the difficulty of assessing how players are actually operating in different systems and how they contribute to success, we probably can’t get closer than “maybe”.

    Which would be the second most unsatisfying way to finish the article.


    The adjustment that could win the Western Bulldogs the Flag

    James Ives

    As the top nine AFL clubs prepare for one of the most even finals series in recent memory, the smallest improvements can be the difference between a first-week exit and a place in the Grand Final.

    At this stage of the season, dramatic transformations are rare. You are what you are. Health remains the most obvious factor in any late-season surge, but more subtle edges can be found in detailed opposition analysis, targeted role tweaks, and exploiting specific matchups.

    For the Western Bulldogs, their weaknesses are there for all to see. Opponents can exploit matchups in their backline, and their aggressive press leaves them vulnerable in transition.

    Luke Beveridge has experimented with solutions, such as redeploying their spare across different lines and adjusting the way they use their wings, but the problem is stubborn enough that some fans have resigned themselves to hoping the Dogs can simply out-attack their opposition.

    But perhaps the answer is simpler than it seems… 

    A small role adjustment for one of the AFL’s elite rucks, inspired by Collingwood’s use of Darcy Cameron.

    Tim English is far from a defensive liability. He averages 2.8 intercept possessions per game (6th among rucks) and 1.4 intercept marks (4th). He’s also kicked 13 goals this season, ranking 2nd in total goals for ruckmen. The issue isn’t what English lacks, it’s that he’s too balanced.

    The Bulldogs’ real problems lie in defence and transition. They don’t need their ruck drifting inside 50 to compete with Aaron Naughton and Sam Darcy. They don’t need him functioning as an extra midfielder on the spread. They need him prioritising defensive positioning and lending consistent support to an underweight backline.

    Cameron offers the blueprint. He positions himself behind the ball at all costs, rarely caught in between his opponent and his defensive responsibilities. This often places him in prime spots to intercept on the flanks and across defensive 50. English, by contrast, tends to generate most of his intercepts deeper inside defensive 50 or along the back flanks. Less proactive, more reactive.

    Possession heatmaps tell the same story. English gathers 14% of his disposals inside forward 50 and shows a higher concentration through the corridor compared to Cameron

    His mobility makes him a genuine asset around the ground, capable of presenting as an option forward or tracking back to defend. It’s his greatest weapon. But when deployed more like a pseudo-midfielder than a pseudo-key defender, it can create problems. 

    Take a look at this Melbourne transition on the weekend. After losing a post-clearance ground ball, Melbourne transition through the wing. English works back to support but is pinned to the boundary after an aggressive back-45 lead from Tom Sparrow. As Jack Viney is held up, English stays pinned to the boundary instead of switching and repositioning himself into the dangerous space. Viney attacks the hotspot, drawing the Bulldogs’ defenders towards Max Gawn, and Melbourne have just enough coverage to crumb and score through Harrison Petty.

    In finals, where margins are extremely fine, the Dogs can’t continue to be exposed inside defensive 50. By adjusting English’s role to mirror Cameron’s, sacrificing some forward forays for consistent defensive positioning, the Bulldogs could address their most glaring weakness without overhauling their system. In a finals series this even, that single tweak might just be the difference between another year of frustration and winning the flag.


    Around the grounds

    • Here’s another plug for the W Download podcast by Sarah Black and Gemma Bastiani, which now has all 18 teams previewed in its recent back catalogue. A must to know what to expect  from each team  this season.
    • Ever see a scorpion kick goal kicked by a player jumping for a hanger? Now you have.
    • On The Shinboner, Ricky Mangidis breaks down how Collingwood have used Dan Houston away from his former role, Carlton’s two gameplans, and Geelong’s use of the Jeremy Cameron attention.
    • The latest Footy A2Z video is about how the rules of the game looked back in 1859. Footy A2Z is a youtube channel with simple informative animated videos about the game’s history and mechanics.
    • Squiggle Football is out! This is author and footy analyst Max Barry’s AFL deckbuilding football management roguelike and it’s pretty good.
  • Round 21, 2025

    Round 21, 2025

    This Week In Football is a collection of some of the best in football currently outside the walls of AFL clubs or broadcasters. Each week a curated grab bag from regular contributors and special guests will provide insight into and beyond the game on subjects of their choosing. For more about our contributors, click here.

    Banner images by Polly Porridge of the True Bloods Podcast. Check out her other design work.

    Before the Bounce

    Sometimes good moments in footy are good.

    Sometimes they come on the field, but there’s the rare off-field moment that raises a smile.

    Trigger warning for Demons fans.

    The utter insanity of the St Kilda comeback against Melbourne has to be seen to be believed. For all bar the most one-eyed of Melbourne fans it’s an example of footy at its electrifying best.

    That led to one of the better off-field moments of the season too.

    Lyon. Nas. Pub. Shoulders.

    There’s going to be a lot written on the future of St Kilda, Ross Lyon, Nasiah Wanganeen-Milera and physiotherapy treatments for men in their late 50s lifting other men on their shoulders, but sometimes you just need to enjoy the game as it comes.

    This week in football we have:


    Winning the close ones

    Joe Cordy

    After a bumpy start to Craig McRae’s first season at the helm of Collingwood that saw them struggle to a 4-5 record, success quickly followed. The Pies stormed home in the back half of the season, winning 12 of their last 13 home & away games to secure a top four spot with the lowest percentage since North Melbourne in 2007.

    What was truly remarkable about the run wasn’t the stark change in fortune, it was the trend that would come to be the defining factor of McRae’s tenure thus far: his side had a preternatural ability to win close games.

    In what must’ve felt like cruel irony, it all came apart in September. Collingwood lost to both of the eventual grand finalists by single goal margins.

    Season over.

    What seemed at the time like the beginning of a regression to the mean failed to materialise the next season however. Collingwood finished 8-1 in single-digit margin games, all culminating in the lowest combined margin from any premiership side to win three finals. 

    Even as their premiership defence fell apart due to an injury crisis that saw them miss the top 8 the next year, their record in close games held mostly steady (albeit allowing a couple of draws and just barely non-qualifying losses through the gates).

    Following their six-point loss to Gold Coast away and subsequent one-point loss to Fremantle at home, 2025 became the first time that this era of Collingwood have ever had a losing record across a season in games decided by a single kick.

    Some analysts of the game would tell you this was bound to happen eventually. There’s plenty of evidence that on a long enough timeframe, any team’s record in such games will regress towards a 50/50 W-L split, and that the results of such games are “mostly luck.” 

    Football, though, is first and foremost a game of skill. While there’s always variance game to game and moment to moment in how well a given player or team executes those skills, as well as elements completely out of your control, you can control enough to tip the scales in your favour. 

    What McRae and his coaching staff have identified and drilled into the team is the effects of chaos and control in close-game scenarios; namely, how much variance you let into the game

    When Collingwood are chasing a lead late they want to play as open and expansive as possible, even to the point of counterintuitiveness.

    Time is the enemy, and so congestion and stoppages must be avoided at all costs, even if it means letting the ball spill out of a tackle. You’re more likely to win back clean possession in open play than a stoppage, and if you’re going to lose anyway it doesn’t make much difference if it’s by one goal or two.

    Conversely, when Collingwood are aiming to defend such a lead, they want to reduce the variance by restricting the amount of football that can possibly happen.

    Time is the enemy, and so congestion and stoppages are the best way to kill it. Search for the boundary, eschew first possession at stoppages so that you can descend on your opponents when they win it, and either continue to clog up the game or win possession back via free kick.

    The principles of it are simple, but nothing comes easily after being physically and mentally drained by running a dozen kilometres and making thousands of small decisions in a brief 2-3 hour window.

    The importance of keeping your clarity of mind was arguably never clearer than during the last ten seconds of Round 20, when Melbourne had lost sight of their rotations so badly they gave away game-defining 6-6-6 free kick, while St Kilda’s star ruck and midfielder coordinated a set play to create an uncontested marking opportunity inside forward-50.

    However, Collingwood’s edge in this area has started disappearing. Not due to fatigue or absentmindedness, but opponents copying their homework. Some of the earlier adopters have looked pretty inelegant, like Sam Draper diving onto the footy and seeming to dare the umpire to call him out on it. 

    Collingwood’s recent match against Fremantle must’ve felt like looking into a mirror.

    While they tried to open up space and get the ball forward by any means available, they faced a team running McRae’s “kill the game” playbook almost to perfection: pinning the ball at arm’s length to create stoppages without dragging it in, hanging off opponents and conceding first possession in order to wrap them up, handballing along the ground to keep the game congested, even descending on their own grounded teammates to make sure the ball doesn’t go anywhere they don’t want it to. 

    It was a genuine masterclass on both sides of the equation, but more importantly it was the clearest example that the tactical niche McRae has carved out for himself is quickly vanishing.

    Collingwood will still have a massive edge in these situations against disorganised, flustered opponents, but they’re unlikely to ever put up records like 8-1 in these situations again. It’ll probably look like a run of bad luck.


    How about a 186cm Full Forward?

    Cody Atkinson

    Are we ready for Jake Melksham, key position forward?

    Well it doesn’t really matter if we are ready or not – the time is here.

    source: afl.com.a

    But how did we get here – whatever this place is?

    When this TWIF correspondent watched the surprisingly enjoyable Carlton/Melbourne game at the MCG in round 19, something slightly peculiar stood out. No points for the guess here – it’s how Carlton responded to how Melbourne were using Jake Melksham.

    The Demons planted the former Bomber deep in the forward line – often as the closest forward to goal. That’s not particularly unusual across the league. Many sides throw a smaller option deep towards goal to throw the traditional defensive set up off kilter. Charlie Cameron played that role regularly for Brisbane’s most dangerous forward lines, for example.

    Usually this attempt succeeds, and the tall defender usually assigned the deep anchor role is forced up the ground to follow taller timber. In theory it diminishes the ability of the attacking side to take contested grabs inside 50, but it helps generate space and cause disruptions.

    Melksham has also been one of two dangerous forwards for the Demons all year – alongside Pickett. Fritsch has had his moments, but the stocks have been pretty bare this year.

    As alluded to above, Carlton didn’t respond in the usual way. They didn’t stick a small or medium sized defender on Melksham. Instead, they tasked All Australian key position defender Jacob Weitering on him. In isolation this matchup worked for Carlton – Melksham managed just one goal for the game and one mark inside 50, with Weitering hoovering up 6 intercept marks.

    TWIF asked Voss about the match-up after the game.

    “How important is it to have a tall (Weitering) that is mobile enough to go with someone, I guess, you know, half a foot a foot shorter than him? 

    Yeah, he’s a big man. So to get past him is a bit of a challenge. You want to be able to build a defense that can play tall, small – take their turns when they need to. That seems to be what modern defenses are all about. Play a little bit more with where your relevance is to the ball and where your strengths lie…At the same time, we’d like him further up the ground doing what he does best, which is obviously generating and interrupting opposition’s passes of play.”

    For the Demons the tactic is likely bourne out of desperation – a lack of reliable talls to direct traffic through. This make Voss’s response to the situation easier – without multiple credible tall targets deep, it becomes easier to place the most mobile one on the deep anchor – even if that anchor is on the smaller side.

    So how does this all relate to Jake Melksham, 186cm KPP?

    It’s worth noting this is the first year that Melksham is considered to be a tall forward. That’s down not to just how Melbourne have used him, but also how teams like Carlton have responded in kind.

    It turns out that some player classifications are determined not just by position on the ground and particular nominated roles (such as ruck), but also by the players that are determined to match up on them. Champion Data employees callers at the ground to not only determine what happens on the field but also on field matchups. These matchups are relatively rigid and static. The nature of the role perhaps doesn’t reflect how modern footy is played – but that’s a tangent for another day.

    @sportsgrad_

    So, you’re telling me I can get paid to watch footy 🤯  We went behind the scenes with Champion Data to see just how they tell the story of the game and deliver live stats to you in seconds ⚡️  Follow us to learn more of some of the most epic jobs in the sports industry! #jobsinsport #championdata #afl #aussierules #analytics #dataanalytics #fyp

    ♬ original sound – SportsGrad

    It’s these matchups that feed into the player classification model. The type of forward (key or general) is determined not just by where they line up on the ground, but also who lines up alongside them. Because sides like Carlton have sent KPDs to mind Melksham, Champion Data have determined that the small to medium sized forward is actually tall.

    Determining player positions is tough in modern footy. The days of the standard footy field grid are long in the past when looking at how teams actually operate on the park. Interim measures – such as the Champion Data classifications – are increasingly being stretched by inventive coaching and game evolution.

    Further research is being done at both club level and by independent analysts. TWIF’s own James Ives has teased different player classifications, while former legend The Arc developed his own model way back in 2016.

    Or maybe Jake Melksham is just a 186cm KPP? Probably not, but maybe?


    In the margins

    Emlyn Breese / CreditToDuBois.com

    What statistics are correlated with winning and losing in season 2025? And how do those correlations differ for different teams with different strengths and game styles?

    This article comes with an acknowledgement and a few disclaimers. I wouldn’t have been able to do this without the incredible work of Andrew Whelan of WheeloRatings.com – having such a rich data source as a base meant I could take the time to pull together the analysis.

    The disclaimer, for the purposes of this piece, is that I’ve used really simple linear regression with r2 as the basis for determining correlation. It’s not something you’d use to try to put a predictive model together, but it does enough to allow us to draw some interesting points.

    Another disclaimer is that correlation is not causation, and doesn’t establish directionality. For example, West Coast’s margins are more strongly correlated to their ruck output than the rest of the league. Is that because when Bailey Williams and Matt Flynn have managed to win the battle, Harley Reid is able to go to work, or is it that an opposing ruck getting bested by them is emblematic of a team ripe to be beaten by West Coast?

    It could also be that a given stat is a real non-negotiable for a team, it’s something they can be relied to win week in week out regardless of the end result – which would be reflected in a low correlation. The data can hopefully lead us to some interesting points for discussion, but can’t be definitive one way or the other.

    Lastly,it is worth noting that I have used stat differentials (team minus opponent) rather than raw stats when correlating to margin, so keep that in mind.

    With that out of the way, let’s get into the statistical correlations.

    As you’d expect, kicking more goals than your opponent is very strongly tied to the final result. Champion Data’s rating points are also very closely correlated.

    We can see that xScore has a higher correlation with victory than the pure number of shots, which we’d expect from a measure that incorporates not just the volume but the level of difficulty of shots taken.

    Among score sources, Points from Turnover appear more valuable than Points from Stoppage, unsurprising as turnover is the primary scoring source. Points from forward half are a better predictor than points from defensive half.

    xScore rating, that is how well the teams are executing on the shots at goal they generate, appears to be worth about as much as a gap in uncontested possessions, which is a better predictor than contested possessions or clearances.

    Commit more clangers than your opponent and you’re likely to lose, however the correlation is relatively weak (to have a clanger you’ve generally got possession first).

    Defensive half pressure acts is a rare example of a “positive” stat with a negative correlation to margin. If you’re racking them up, it means both that the ball is in your defensive half and the opponent has control of it.

    We’ve got the league averages, so where and how does each team diverge on individual statistics?

    The arrow indicates the direction a team diverges from – a red arrow to the left means that stats correlates less (or more negatively) with margin for the team than for the league at large and blue indicates stronger correlation.

    Adelaide win through having a better spread of goalkickers than their opponents. They’ve had more unique goalscorers on 10 occasions for an eye-watering average margin of +62 points. Handballs are more valuable in their games than average, and kicks less so. The gap in value of points from forward half compared to defensive half expands.

    They also don’t rely on a high mark inside 50 differential as much as the rest of the league. To revisit our disclaimer, this doesn’t necessarily mean they’re bad at it, just that it hasn’t correlated with winning and losing to the same degree it has for other teams. Adelaide has lost 5 games for the year – in three of them they won marks inside 50 and in a fourth they drew. They’ve lost marks inside 50 three times, and won two of those games. They’ve drawn it three times for a three point loss and two 10+ goal wins. They’ve also managed to win by 10+ goals with a +0,+0,+1, and +2 marks inside 50.

    Brisbane aren’t converting xScore into wins particularly well (because they’re 4th worst in goal accuracy this year). They’re getting more value from centre clearances than most teams, and appear to not be as affected by turnovers. This is partly driven by the fact that they haven’t had a turnover differential larger than 8 in the positive or negative whereas a quarter of games league-wide have blown out past this.

    Carlton don’t often lose more defensive 1 on 1s than their opponent, only on four occasions so far and never by more than two. Their biggest wins against West Coast and North saw them win the stat by 6 and 4 respectively. When they’ve been required to make more defensive half pressure acts than their opponent however they’ve got an average margin of -24 compared to +20 the other way. 

    Similar to Adelaide, Collingwood benefit from having a better spread of goalkickers than their opponents. All of Collingwood’s losses have come while winning the inside 50 count and three of the four came while also winning the marks inside 50 count, including a three point loss to Geelong while recording their best differential for the year (+9).

    They’ve only lost the tackle count once all year, in their opening round drubbing by GWS. While they recorded a solid +21 tackles in their 1 point loss to Fremantle, the other two losses saw low differentials (for Collingwood) of 8 and 10. Three of their four biggest wins have matched up with their three biggest tackle differentials. Their pressure game also helps explain why they can lose the kick count convincingly and still come out on top. 

    Essendon want clean hands. Their average result is a 47 point loss when recording more ineffective handballs than their opponent, compared to just a 9 point loss when recording fewer. This is mirrored in effective disposal tallies. It’s not surprising, decimated by injury my best guess is that they just don’t have the drilled structures in place to respond to errors so when things go bad there is little damage mitigation.

    It’s been a common theme of criticism that Fremantle can tend to rack up meaningless uncontested possessions. They’re 7-3 in games they win the count and 6-3 when losing it, but with a slightly better average margin. By comparison their average margin when winning contested possession is +26.2 compared to -10 when losing it.

    Geelong benefit from winning the intercept game as well as tackles inside 50. When the Cats have recorded +8 tackles inside 50 or better they average a 65 point win. On the two occasions they’ve achieved -8 or worse they’ve lost by 18 and 41. They also don’t mind getting on the positive end of some xScore variance. Points from stoppage aren’t as big a predictor for them as others.

    Gold Coast are towards the bottom of the league for post-clearance ground ball, but they’re 8-1 when they’ve won the stat. They boast the same record when winning crumbing possessions, but are dead average in the stat across the season.

    GWS have only won points from centre bounce in 6 games this season, but they’re 6-0 with an average margin of +45 when doing so. They’re not as dependent as most teams on building an xScore advantage to win, because they outperform their opponents on xScore rating by a maddening 10+ points per game.

    I’ll be back next week to step through the remaining nine teams as well as hopefully looking at which teams do or don’t have their performance captured well by Rating Points.


    Comparing this year’s finals race

    Sean Lawson

    The race for finals is down to 9 teams with a month left to play in the regular season of 2025. Sydney’s loss to GWS dropped their already remote finals chances to the purely mathematical realms involving multiple wooden spooner upsets, two collapsing teams, and improbable percentage boosts.

    The remaining equation is pretty simple. One team from the top 9 is going to miss out, and after the Dogs smashed GWS last night, there’s 4 teams (GWS, Hawthorn, Freo and Bulldogs) with a decent chance of missing the cut.

    With 4 weeks of the season to go, this is unusually early for so few teams to be in the hunt for finals in the 18 team era.

    The peculiarity of this season’s ladder is naturally being used to argue for an expansion of the finals to ten sides, so more teams can avoid dead rubbers for longer. However, Greg Swann appears to see the 10-team finals series as a change to be made when there’s 19 teams.

    Most years since 2012 have seen several clubs still in close contention for catching 8th spot. Indeed, some recent seasons have still seen the team as far adrift as 13th a viable chance of qualification, although on average, the top of the bottom 6 has been more than three games behind the pace.

    2016 was the last year where so few teams were in contention for finals a month out. In 2016, there were three games separating North Melbourne in 8th from St Kilda in 9th. Funnily enough, this was the season where North opened by winning 10 of their first 11, and by August were in open free-fall. North failed to win another game after round 20, and the Saints only missed finals on percentage.

    If making up 1 or 2 games on 8th is reasonably possible with a month remaining, most years we can expect up to four teams to still have fans furiously running their ladder predictors and death riding certain opponents.

    This year, all of the calculation of permutations is confined to the top 9 sides. The big reason there’s such a small chasing pack this year is that the fringe finalists are simply losing fewer games.

    This year is the first season since 2018 where the team in 8th has only lost 7 games to this point. Further, with the longer season thanks to Gather Round, the Suns on 12 wins are the winningest 8th place team yet seen in the 18 team era.

    A further consequence of the success of the teams ranked 5 to 8 is that a winning by teams outside the top 4 is that the actual positional spread within the top 8 is quite close at the start of Round 21.

    Those stronger results for the bottom few teams, and the lack of a runaway ladder leader, mean nearly everything is still up for grabs.

    The last few weeks of the season should be a tight jostle for home finals and double chances, everyone in the finals race has winning form to point to, there’s no clear single standout leading team, and it’s honestly strange that so many commentators seem to think that this all constitutes a “dismal” or “boring” season. 


    Around the Grounds