This Week In Football is a collection of some of the best in football currently outside the walls of AFL clubs or broadcasters. Each week a curated grab bag from regular contributors and special guests will provide insight into and beyond the game on subjects of their choosing. For more about our contributors, click here.
Banner images by Polly Porridge of the True Bloods Podcast. Check out her other design work.
Before the Bounce
Carlton understood Good Friday far better than North Melbourne (it’s the crucifixion, you save the resurrection to Sunday).
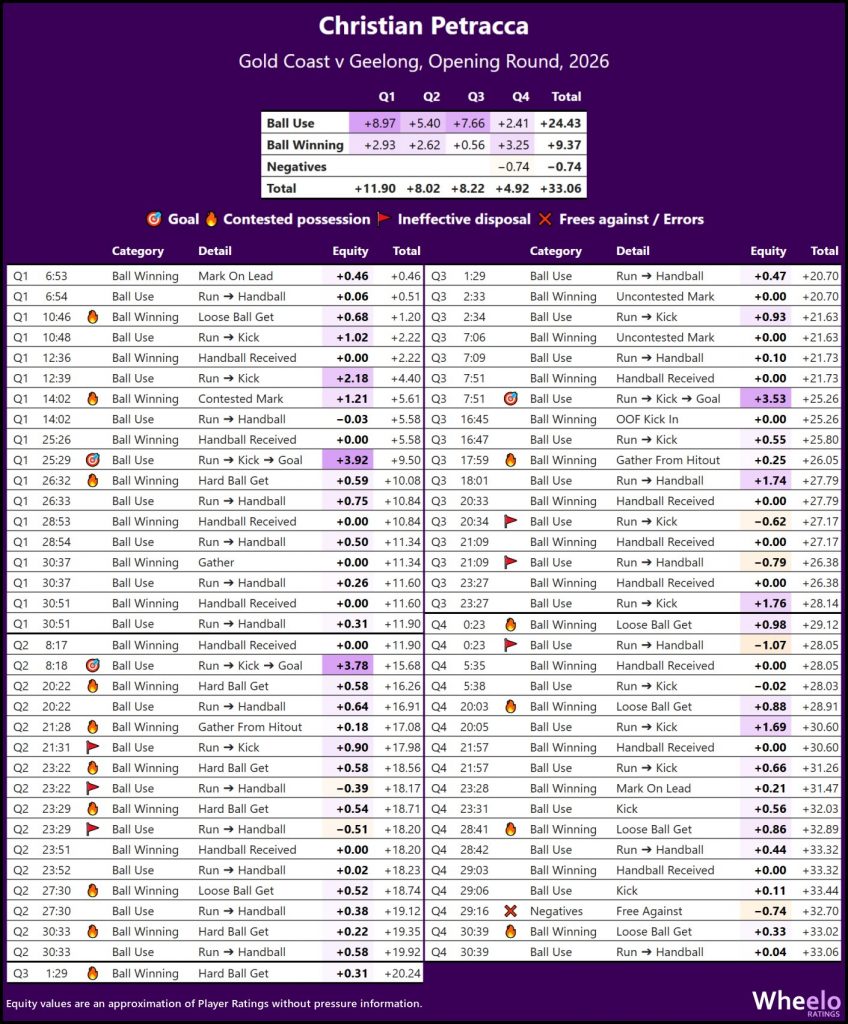
Christian Petracca dodged the dees as they put a dint in the Suns record, while the dogs limped to a disappointing 5 goal win.
The less said about the bird battle the better. Adelaide was robbed by Fremantle not receiving a warning with 7 minutes to play.
Oh yeah and on Monday the Hawks and Cats put on yet another one of *those* games to pretty much everyone’s amazement yet noone’s surprise.
We’ve got figures reported at face value that are, quite literally, too bad to be believed.
And we’re all auctioning off our kidneys to fill the tank up and make the road trip to Adelaide.
This week in football we have:
- Joe Cordy – Quality & Execution
- Lincoln Tracy – Gather Round for More Fixturing Quirks
- Emlyn Breese – The Footy is Good, Actually
Quality & Execution
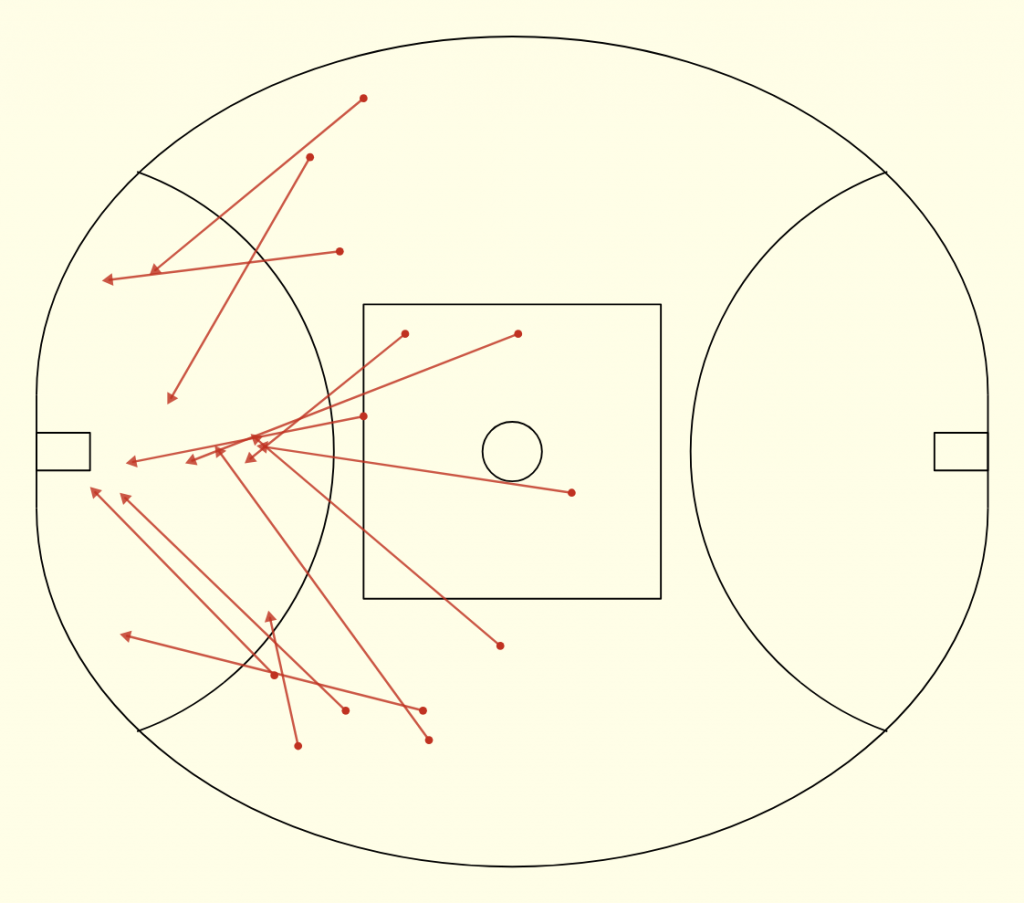
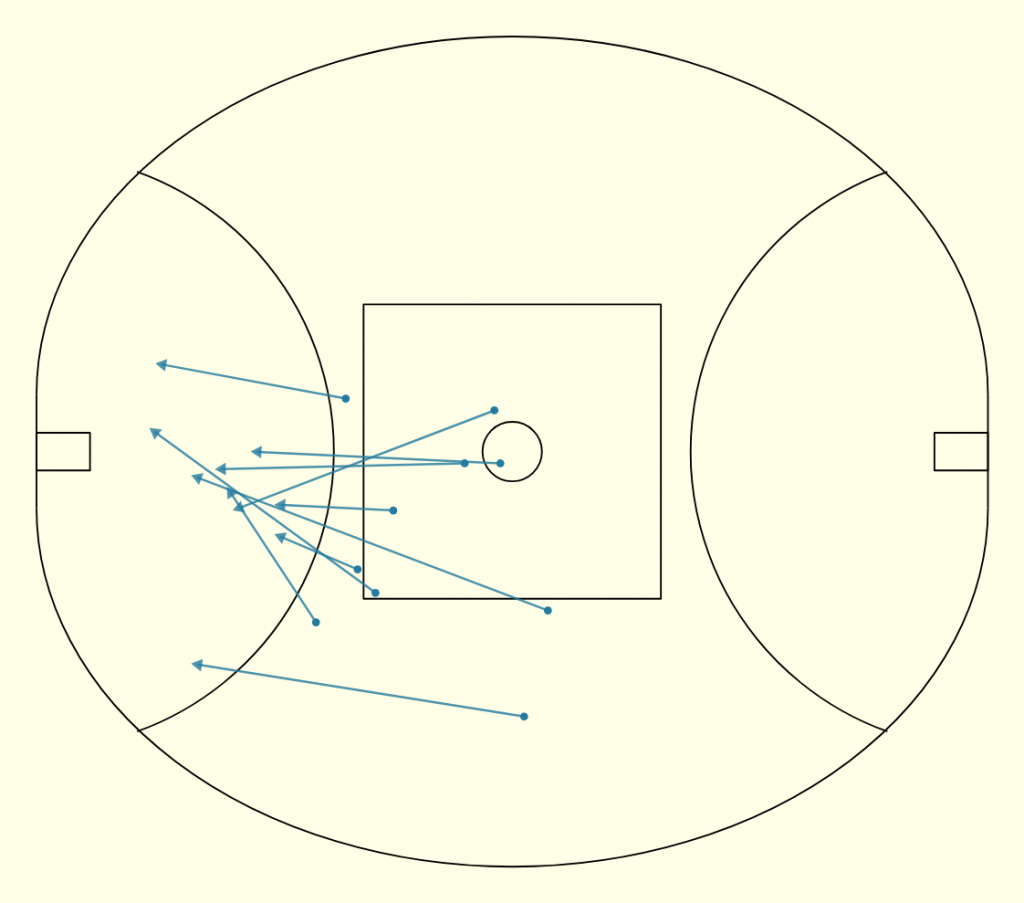
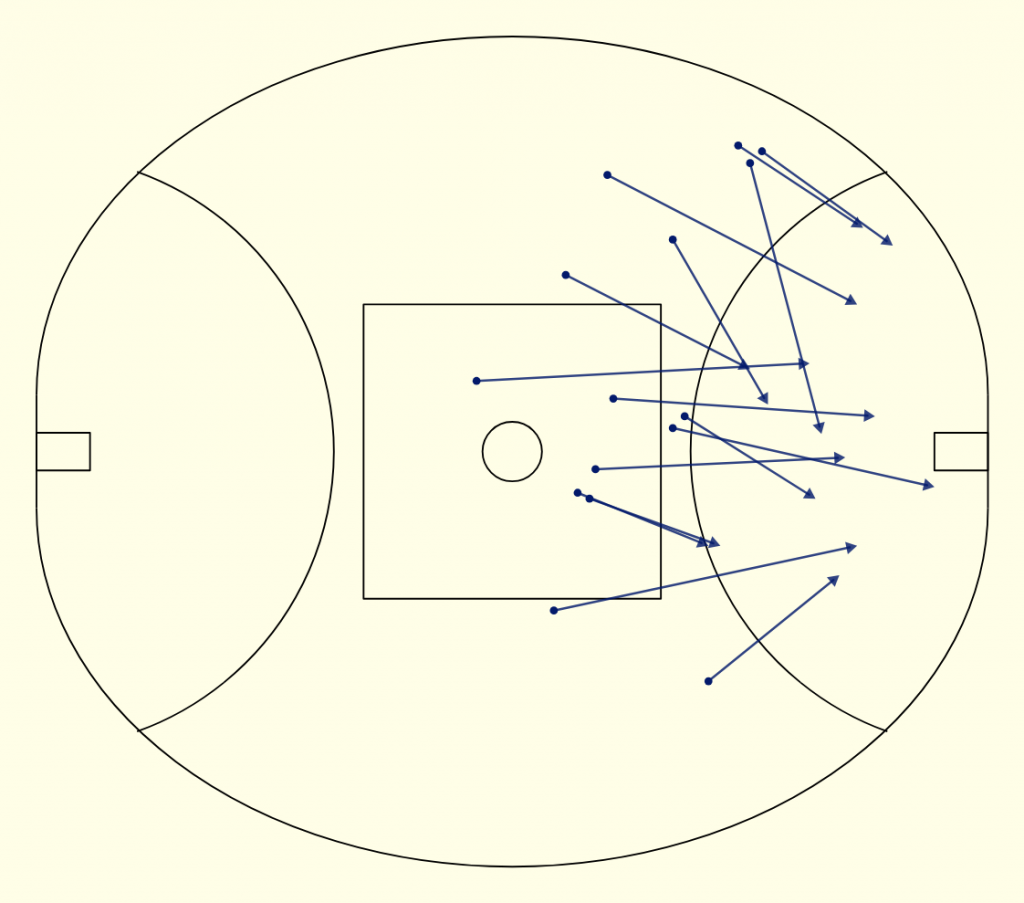
Right on the stroke of halftime on Saturday night Isaac Heeney slotted a set shot for his second of what would become a bag of four goals, to push the scoreline out to 2.8.20 – 13.5.83 at the midway point. It’s just one aspect of a complete shellacking for the Eagles, but eyes are immediately drawn to the 1:4 ratio of goals to behinds. Even though it’s a pie in the sky, fans can’t help but picture what the game would feel like if they’d somehow managed 10 straight.
What gets lost when each score is stripped of its context however is that the Eagles weren’t kicking terribly from gettable shots, they were being forced into bad positions by the Swans. Accuracy didn’t move the needle compared to sheer volume of scoring opportunities in this match (if the Swans had missed on every one of their goals they’d still have won 35-41), but it’s often a determining factor between two evenly matched sides. It’s worth considering then who’s taking the most from their opportunities, and who’s creating the best opportunities to be taken.
Expected Scores
Before we get into that it’s worth giving a brief explainer on Expected Scores or xScore, as it’s the foundation I’m going to use to measure accuracy and quality. The simple version is that every shot at goal is given an xScore value based on the average of points scored from all similar shots, grouped by location on the field, whether it’s a set kick or in general play, and in the case of general play what pressure was being applied to the ballcarrier.
For example: if there have been 100 shots from the same situation and 50 of them went through the goals, 40 swayed either side, and 10 failed to score entirely the xScore value of that shot would be calculated as (50 x 6 + 40 x 1) / 100 = 3.4 points.
Since the start of the 2021 season there have been just shy of 55,000 kicks recorded as deliberate shots at goal. Unsurprisingly, set shots are both more valuable and more sought after by teams.
If it were easy to live on a diet of set kicks a stone’s throw from the goal line though every team would do it, but you have to take what the opposition offer you.
The Value of Accuracy
As you might expect from a team with the current Coleman Medal leader, who’s kicked 17.2 from just 21 shots (and only 24 kicks), Gold Coast are so far out ahead in xScore rating (difference between score and xScore) both per shot and per game they’re nearly lapping 2nd place.
Accuracy is a hugely volatile skill however, and four games is still a few shy of a healthy sample size. It’s worth comparing teams against their 2025 selves to get a better baseline. With it we can see what a massive jump Gold Coast have made to begin the 2026 campaign, and get a suggestion of how unlikely it is to be sustained through to September.
Across a full season, most teams sit within +/- 0.2 points of their expected accuracy per shot…
…and approximately one goal per game.
Knowledge this regression is coming is cold comfort to a team like Geelong who have already been on the receiving end of a combined six-goal swing from xScore in an Opening Round loss to the Suns, but it’s still worth considering that everyone will regress to the mean in time. Who then are keeping that baseline the highest?
The Value of Quality
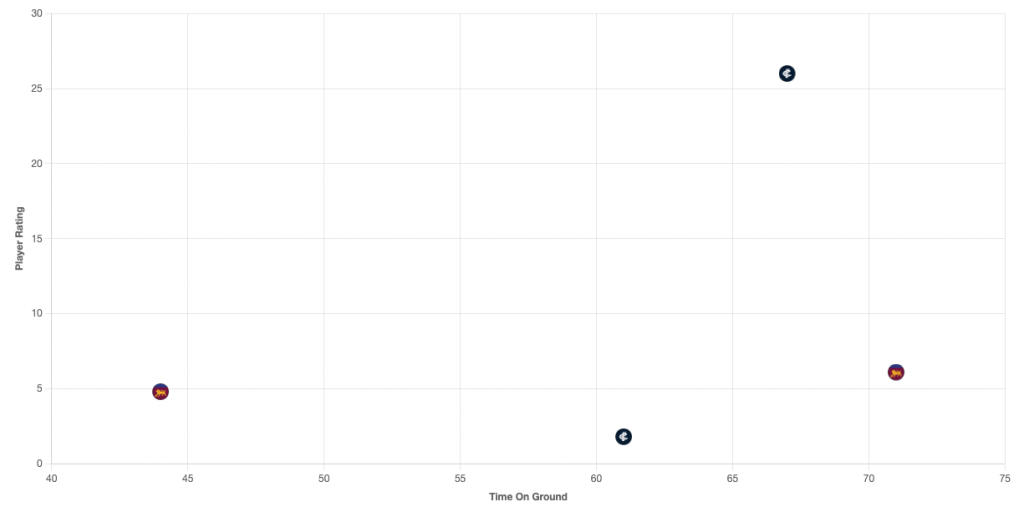
In the continued legacy defining search for success this decade, Beveridge’s Bulldogs and Clarko’s Roos picked up where they left off in 2025 – refusing to settle for anything but the highest quality looks at the big sticks.
What sets Beveridge apart from his one time mentor however is that the Dogs have maintained this level while keeping such a high volume of shots. They led the league for shots at goal per game in 2025, continue to do so in 2026, and are adding nearly 10 expected points more than average because of the combined quality of these attempts.
On the other end of the spectrum, GWS’ early woes can largely be put down to the expected regression from accuracy and an unexpected regression from quality. Even though it moves the needle less shot to shot and game to game than accuracy, the quality of shots is much more stable a predictor, and their decimated lineup no longer seems able to create the same constant supply for Jesse Hogan that he had been enjoying.
Putting it All Together
So far to start the season, Gold Coast sheer accuracy in front of goal has put them more than three goals ahead of the league average score for their number of shots produced, mirroring their coach’s archrival lagging just as far behind.
While there are a glut of teams in the middle of the pack who are dragging themselves in two directions, history tells us these and the Cats’ and Suns’ outliers are irregularities that will be hammered out in the fullness of time.
While there are close to perfectly average teams last year, none of them were being pulled in both directions to a massively significant degree. Similarly, the best and worst of the group sat at +8.3 and -5.2 points per game respectively.
When it comes to sustainability, the Bulldogs know there’s no reason they can’t keep scoring at their current extraordinary rate as one of the only teams to not be facing a significant bump up or down to begin the season. Gold coast and Sydney will both be looking to consolidate their gains, even though Brisbane have proved being above the league average isn’t a prerequisite to flag glory.
Ultimately, nothing will ever be more important in footy than generating scoring opportunities. Kicking 10.0.60 would be impressive and a great bit of trivia, but wouldn’t do you any good against a side putting up 24 goals from 45 shots. Teams are constantly looking for every edge they can get however, in a league where it’s harder than ever for top teams to pull away from the pack. Bad kicking is bad footy, after all.
Gather Round for More Fixturing Quirks
Lincoln Tracy / lincolntracy.substack.com
We are five rounds into the 2026 AFL season, and one thing that people have not stopped talking about since the ball was thrown up for the first time on March 5th is the uneven nature of the fixture.
Only one of the completed rounds to date has featured all 18 teams, and it took until the most recent group of games for all the teams to be back on level footing with respect to the number of games they have played.
And with no further byes scheduled until Round 12 (as well as Rounds 13, 14, 15, and 16), you would think that some of the fixturing chat would die down for the time being – especially with the AFL world descending on Adelaide for the 2026 edition of Gather Round.
You could think that, but you would be wrong.
There have been multiple instances this week when the football media (and plenty of fans online) have been vocal about which teams play at the state’s crown jewel, Adelaide Oval, and which teams find themselves heading out to Norwood Oval or Barossa Park in Lyndoch (or Mount Barker, in previous years).
For example, Jon Ralph opined about how Brisbane, the back-to-back premiers, have been disrespected since the inaugural Gather Round back in 2023 by not getting the opportunity to play at the Adelaide Oval.
Ralph goes on to discuss whether the Lions really care about the fixturing for one weekend over the course of a season, which I feel is a completely reasonable view to take.
“As Leigh Matthews would say, don’t complain and don’t explain,” he wrote.
These types of conversations can go on forever and ultimately come back to the fact that the AFL knowing they can maximise ticket sales and advertising dollars by playing certain clubs in marquee timeslots at the Adelaide Oval over other clubs.
Instead of having a slightly different version of this conversation yet again, I want to go in a different direction and really lean into the quirks of the draw over the past few years when all nine games are played in the only state that shares a border with every other mainland state.
Here’s a breakdown of the unique number of opponents and venues each team has played against and at in Gather Round, including this year.
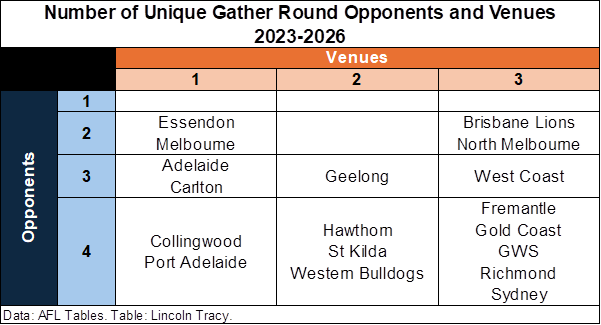
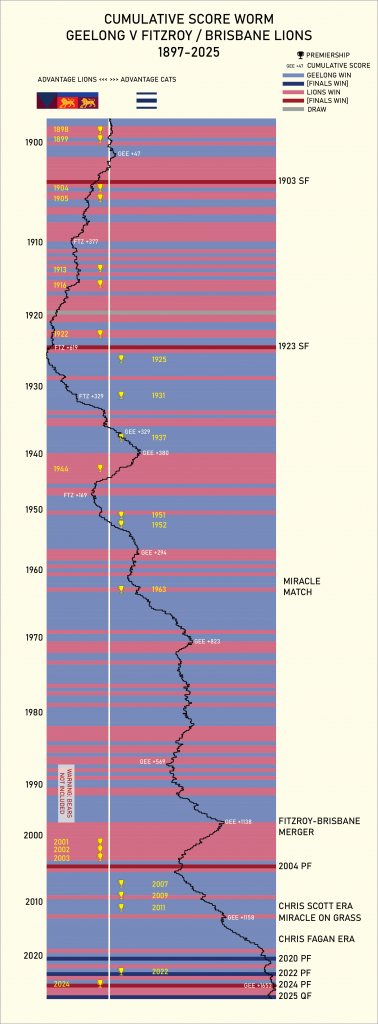
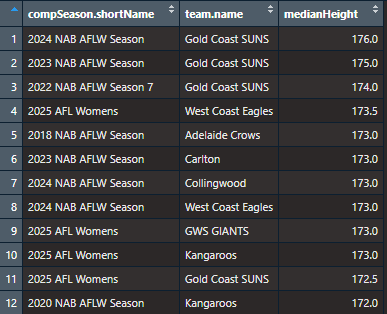
Chris Fagan’s side has drawn North Melbourne for the third time in four years, with Barossa Park becoming the third venue these teams have played at during the festival of football after Mount Barker in 2023 and Norwood in 2024.
These matches, which the Lions won by 75 and 70 points, are a key reason why Brisbane sitting atop the Gather Round ladder with a percentage of 176.85 while North are last, winless with a paltry percentage of 51.36.
The Lions and the Kangaroos, along with Gold Coast and Greater Western Sydney, are the only teams not to play at Adelaide Oval during Gather Round.
Compare this to Collingwood, who play their fourth different Gather Round opponent in as many years when they “host” Fremantle on Friday night, having beaten St Kilda in 2023, Hawthorn in 2024, and Sydney in 2025.
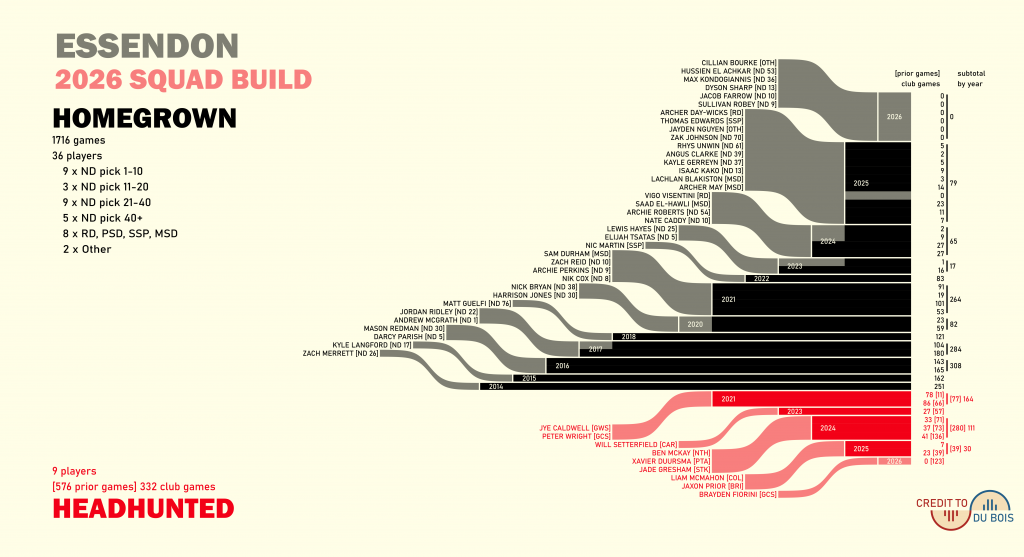
Craig McRae’s men join Adelaide, Carlton, Essendon, Melbourne, and Port Adelaide as sides that have not had to cross the famous footbridge and play beyond the Adelaide Oval.
Essendon and Melbourne will also face off for the third time in Gather Round but still both played at the Adelaide Oval in the one year they weren’t drawn to play each other (2024), being fixtured against Port Adelaide and Adelaide respectively.
Geelong may also be a bit miffed with the draw this year. After three years on the big stage, they will head to Norwood for the first time to play the Eagles, their opponents from the inaugural Gather Round, in the early Sunday game. It’s also the first time the Eagles will run out at the narrow suburban ground, having played at Adelaide Oval in 2023 and 2025 with a trip out to Mount Barker in between.
The Dockers are one of five sides who have experienced the most variety in terms of who and where they have played, along with the Suns, Giants, Tigers, and Swans.
But despite all this variety, no side has played at all four of the venues used over the history of Gather Round.
Six different sides played at Mount Barker in the first two years (Brisbane, North, West Coast, Sydney, Gold Coast, and GWS), yet each of them has a venue they haven’t visited.
As mentioned before, the Lions, Roos, Suns, and Giants haven’t played at the Adelaide Oval, while Sydney and West Coast are yet to feature at the Barossa.
Perhaps this will happen next year, when the AFL and the South Australian government agree on terms for an extension to this initiative.
On a more serious note, I hope everyone who is attending Gather Round has a great time. I attended in 2023, driving over from Melbourne with a carful of mates on the Thursday. Things got off to a rough start when Carlton got rolled by Adelaide, but we still enjoyed ourselves immensely. Travel safe!
The Footy is Good, Actually
The game has never been in worse shape and people are abandoning it in droves. At least that’s the overall picture you might get if you listen to the vast array of people who are paid to comment on the sport despite appearing to actively despise it and wishing they were back in the 1990s.
Crowded out
Crowds are plummeting, even the esteemed AFL Fans Association says so (picture below).

Some stark numbers, but do they actually add up five rounds in?
Looking at the raw numbers mean figures are up on last year while median figures are down. Neither reach the 2023 peak but both are still healthy.
However, attendance is heavily influenced by the teams playing and the venue, so can we get more of a like for like picture?
For each match occurring in rounds 0-4, I’ve looked to see whether there are matches in other years also occurring in rounds 0-4 at the same venue with the same teams.
Where there are multiple matches to compare, I’ve calculated the percentage increase of a matchup against the mean attendance for that matchup.
Across a season I’ve then calculated the median and mean percentage increases across all shared matchups.
In doing so we can see that comparing like for like matchups the 2026 season is performing extremely well. It has the highest mean and median increases. Crowds are well up for the fixture we have had so far.
In the Margins
We’ve got the people, how about the games?
We currently have the highest recorded final quarter lead changes (score progression data goes back to 2001) and the third highest total lead changes per game.
You’re more likely than ever to see the lead flip in the final quarter.
How about margins in general? We’ve never had a higher proportion of games decided by 2 goals or fewer, only one season (2024) where more games have been decided by one goal or fewer, and only one season (2019) where more games have been decided by four goals or fewer.
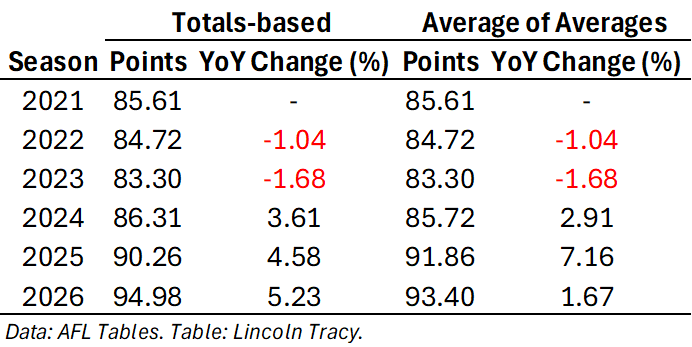
If we look at the mean figures we see that margins have climbed over the past couple of seasons but still relatively low, total points continues to grow post-covid (the decline started pre-covid), and the ratio of margin to points scored is in line with figures over the century – the notable exception being consistent low values through 2003-2007. I for one am happy to accept slightly higher margins to avoid the football terrorism waged by Paul Roos and John Worsfold in the mid ‘00s.
Keep ‘em separated
Lastly, there’s been a lot of discussion over at Fox Footy about the idea of this being a season of two divisions – a clear bottom 6 and then the rest. The bottom 6 haven’t landed a punch on the top 12, with a record of 0-8 and an average margin that once Sydney had dealt with West Coast sits above 10 goals.
Sounds pretty bad, right?
I wanted to at least add a bit of context to it though. I’ve used the 15 seasons with an 18 team competition. For each season I’ve found the group of 6 teams that had the most losses against the other 12 teams before having a single win.
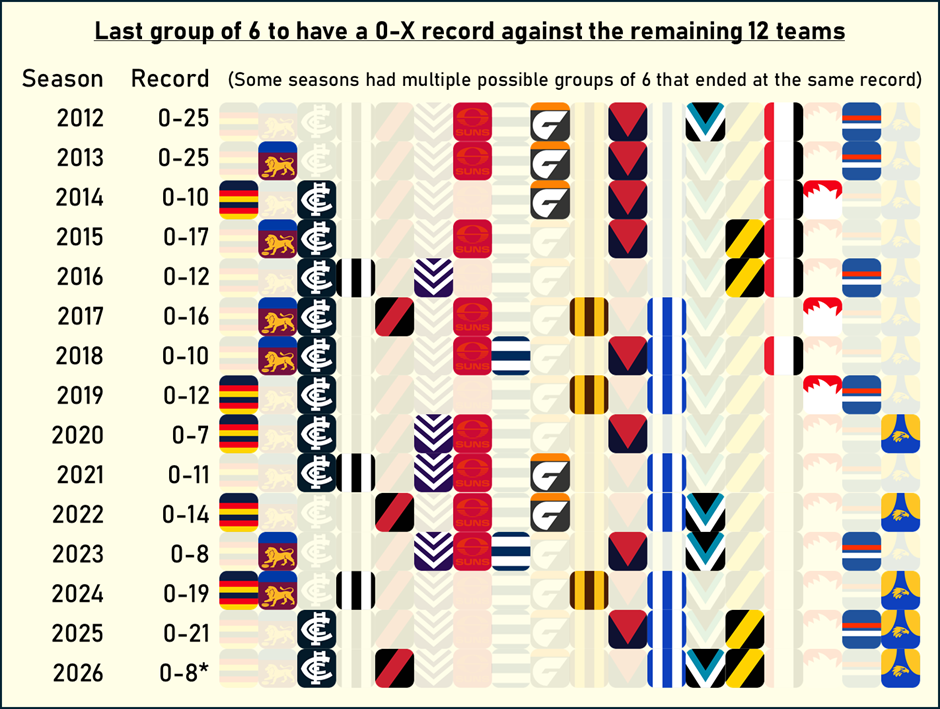
At the moment we’re not in a historically bad place. The only season that has taken fewer than 8 cross-division games to notch a win for the bottom six was 2020. Gather round will be telling. There are no internal matchups within the bad division so we get six rolls of the dice to notch a win. Port beating St Kilda seems the most likely chance, although Melbourne has horrendously underperformed against Essendon in recent years, particularly at Gather Round.
If all six of the bad teams lose we’re then starting to get to the upper end of things but would still be a full 7 losses short shy of last year’s performance.
What if we take the idea of divisions a step further and classify teams using a similar method at the end of each season.
I’ve first grabbed the group of six teams with the best combined win-loss record against the remaining 12 and called them the top division.
I’ve then defined the bottom division as the six remaining teams with the worst win-loss record against the remaining 12. Unsurprisingly the middle division is what’s left over.
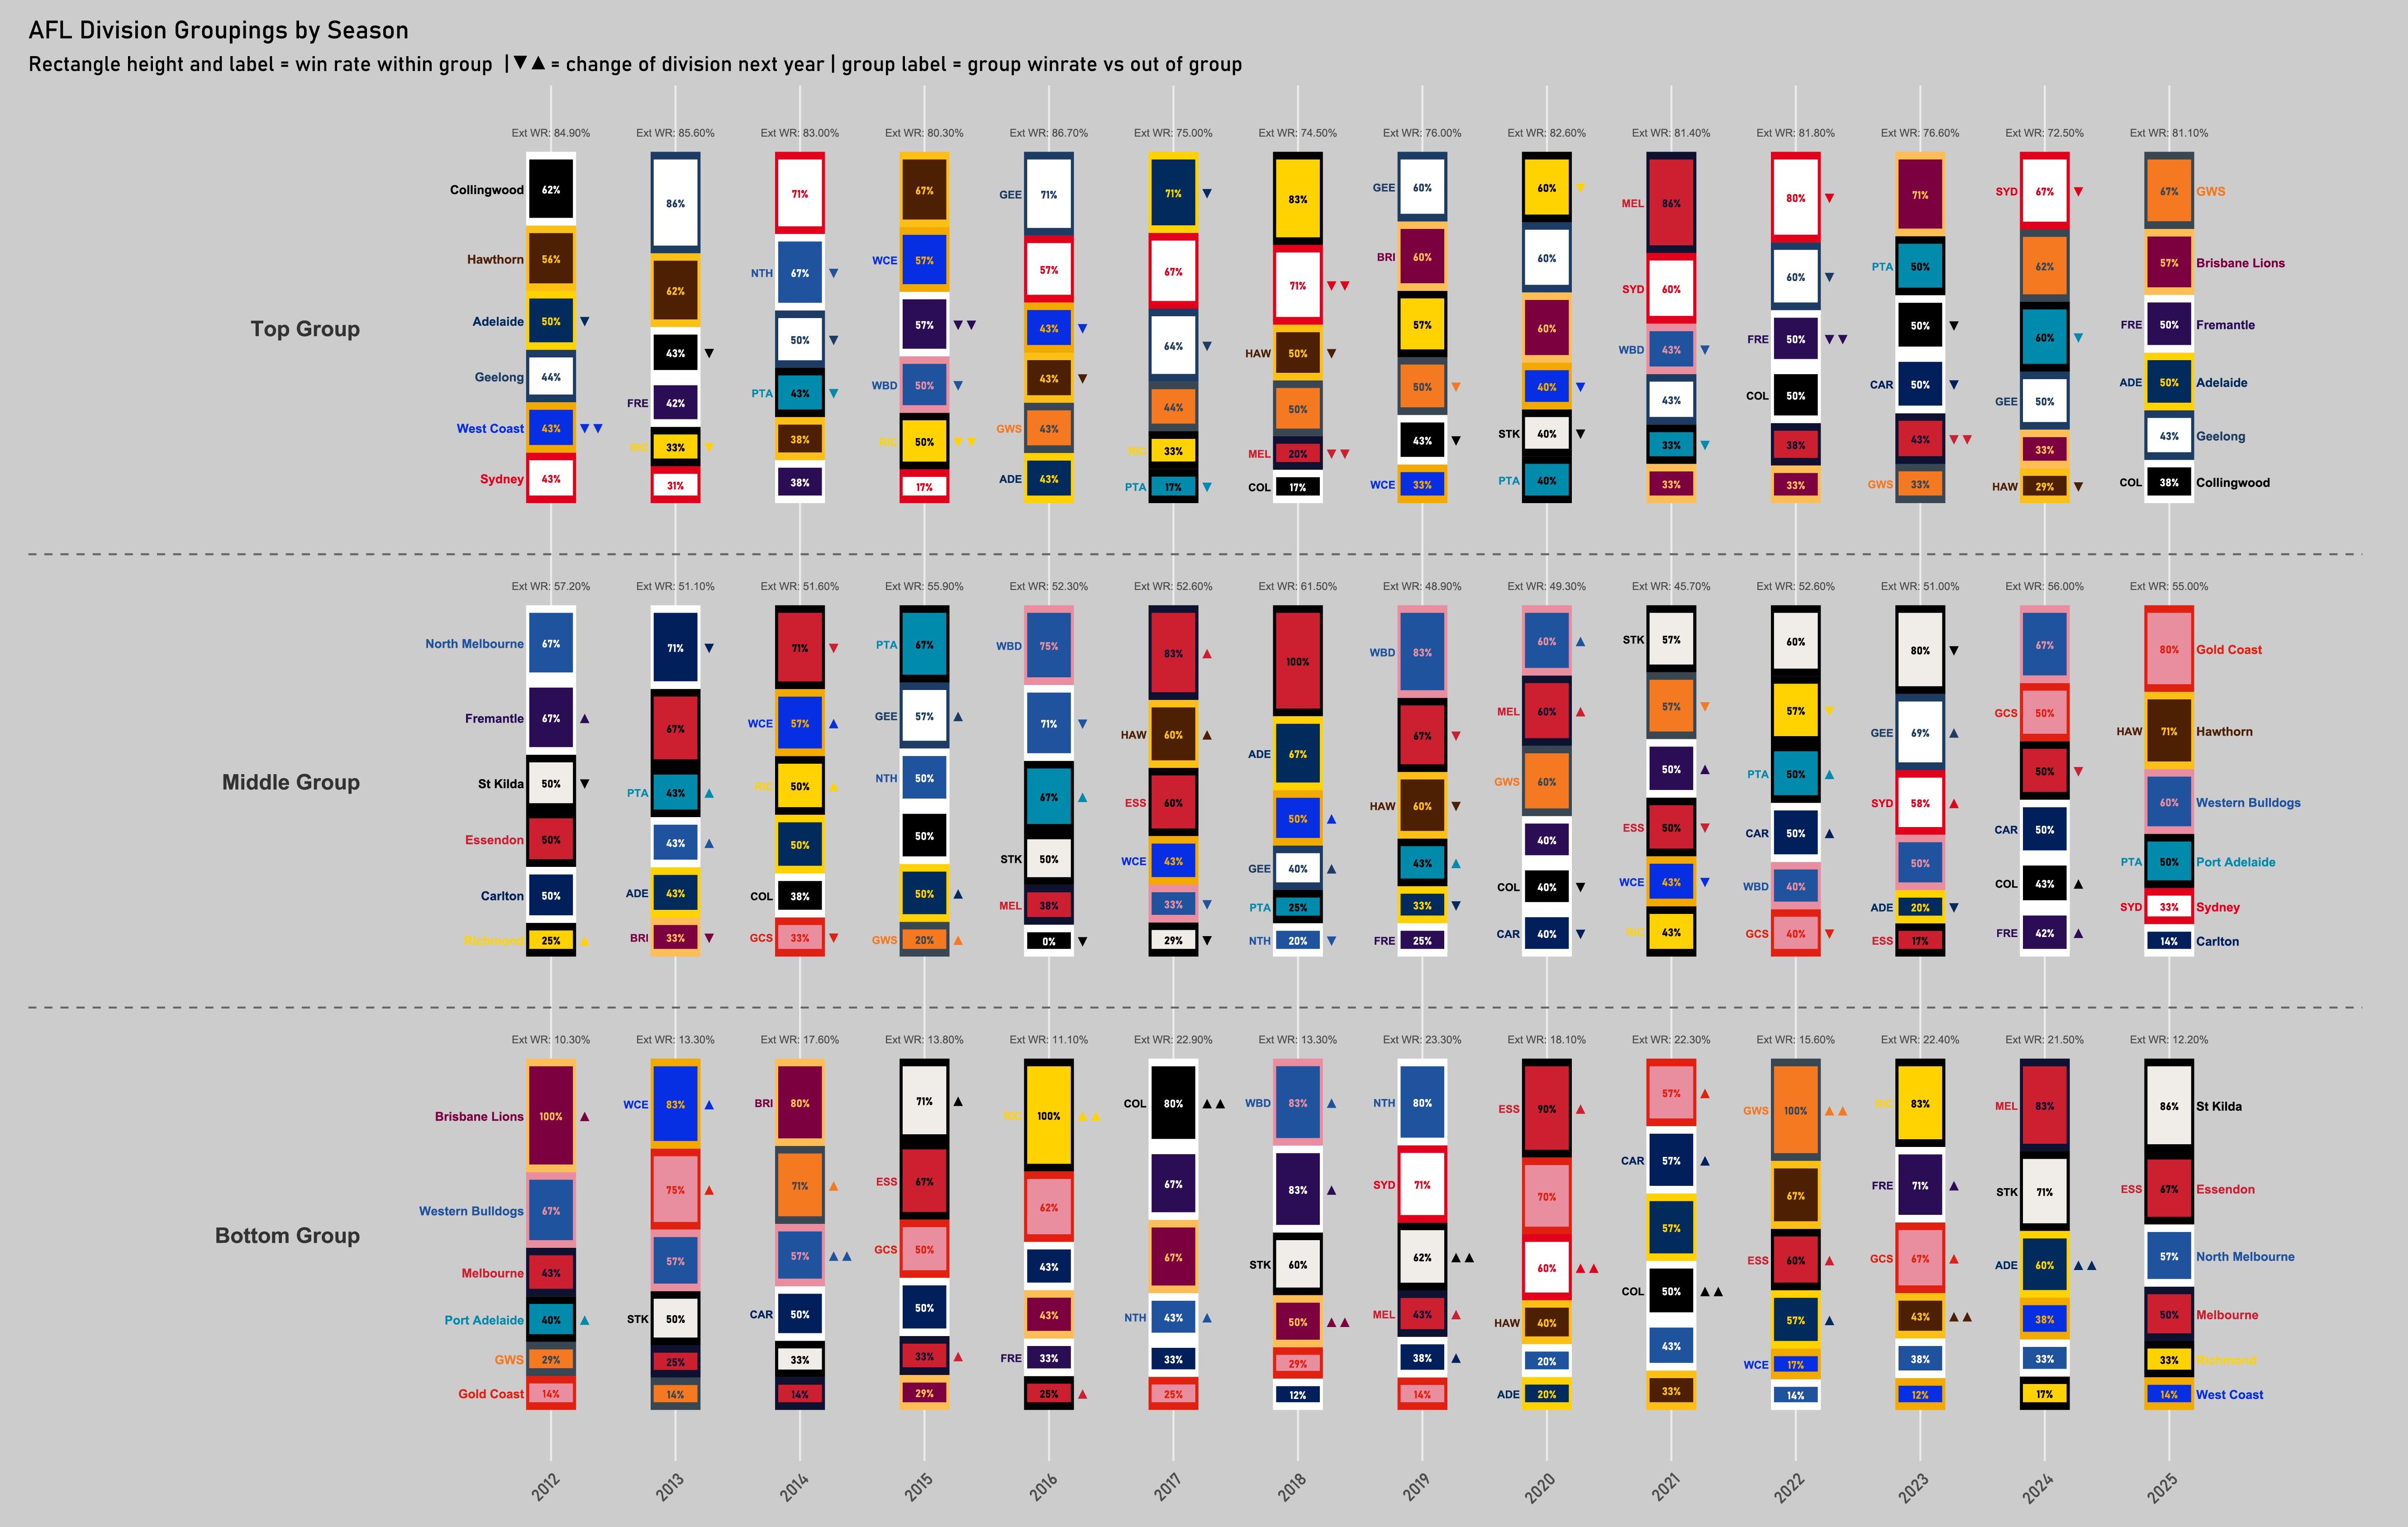
The top 6 win around 75-83% of their games against the remaining 12, the bottom win around 13%-22%, and the middle hover around the 50-56% range.
We can also see there’s more variation within the bottom division than the others. In all but 2021 and 2015 there has been at least one team with an 80% win rate against their fellow bottom sixers. By contrast this has happened only four times in the middle division and three in the top.
Overall I think there’s a compelling case for footy being in really good health. There are bad games, but there always have been. The good games are as good as ever and being played by more teams.
Many commentators harken back to the 80s and 90s as a golden age of football. The vast majority of it is absolute unwatchable dross by comparison. The skills are negligible and pressure non-existent.
In addition to the normal rose-tinted glasses of nostalgia, our views on the past are informed by the fact that we simply didn’t see the bad games as much. For many people their exposure to the game was going to your team’s game on Saturday afternoon then catching a curated three quarters on replay and a ten-minute highlights package of the rest of the round. They never even saw the equivalent of Port vs Richmond.
As for the media landscape that’s a whole different kettle of fish. Maybe we should try something really radical like TWIF’s own Joe Cordy suggested?
Around the grounds
- Two great reads on the draft and equalisation
- Ricky Mangidis’ writing on North Melbourne’s win
- Sean Ross on Richmond
- Sophie Welsh on AFLW and AFLM double-header announcement