This Week In Football is a collection of some of the best in football currently outside the walls of AFL clubs or broadcasters. Each week a curated grab bag from regular contributors and special guests will provide insight into and beyond the game on subjects of their choosing. For more about our contributors, click here.
Banner images by Polly Porridge of the True Bloods Podcast. Check out her other design work.
A quick note from the team.
This week’s edition is coming a bit later than normal due to a cavalcade of misfortunes worthy of the springfield isotopes (or western bulldogs).
Separate to that, we’re going to be moving to a new hosting solution. We’re working out exactly what that looks like.
We’ll migrate subscriber lists across, as well as the archive, so there should be no interruption to your regular service going forward.
Before the Bounce
[inaudible]
We’ve gathered round and now dispersed, fitting then to look far and wide.
Leicester City are celebrating the 10th anniversary of their Premier League trophy by teetering on the brink of relegation. Not relegation from the Premier League, but relegation from the Championship League to the third string league – League One (maybe it’s not just the AFL that needs some help naming things).
Part of this is due to a competition penalty for breaching financial rules in the time they dipped out of the Premier League. Rather than a salary cap, clubs are subject to restrictions on the scale and duration of losses they run.
Effectively, Leicester City kept spending like a Premier League team while drawing Championship League revenue.
I put the question to the official unofficial TWIF group chat: which AFL clubs are protected by the degree to which the AFL restricts their finances (primarily the salary cap and floor).
A pretty quick consensus formed that across the past two decades each of Carlton, Melbourne, St Kilda, and Essendon could have caused irreparable damage to themselves if they had a bit more freedom.
Adelaide was also put forward as a team that might struggle properly identifying where they’re placed at a given moment.
It made me think towards AFLW and the coming introduction of a more traditional salary cap (currently the competition operates under a system of players on set tiers, this would move the competition towards the mens approach of allowing clubs to distribute the cap as they see fit).
I think there’s a legitimate risk that some of the clubs who currently don’t run their women’s footy program well will get them into a lot more strife.
As Sarah Black and Gemma Bastiani noted on a special episode of the W Download, the league can’t be entirely happy that Brisbane’s head of footy is moving to Adelaide, and Adelaide’s heading to Melbourne, in terms of trying to lift the floor of the competition.
This week in football we have:
- Emlyn Breese – Down the garden path
- Cody Atkinson – Nick Daicos as Derek Jeter
- Jeremiah Brown – (Retained) possession is nine tenth’s of the law
Down the garden path
So this is going to be a bit different from me, a bit about process.
This is a hobby. My general approach is hoping a bit of inspiration strikes during the week. A healthy groupchat of footy nerds helps immeasurably. Sometimes it’s a particular piece of play, a random bit of trivia, something I’ve heard that didn’t sound right and I wanted to check.
Often it’s something that I think would be interesting to do in and of itself – figuring out a new way to either analyse or display the data I’ve got. That’s where this week’s piece started. For this kind of piece I’ll usually start writing while I’m going through the data – it’s an exploratory approach so the story I end up with might be pretty different to what I assumed coming in.
I remembered back to opening round, there were a few clips of Carlton looking particularly impotent at defending Sydney’s ball movement. Thanks to the stand rule changes Sydney were able to easily release a handball to a player after a mark multiple times – the defender who contested the mark had to stand, they couldn’t back outside of the protected area to better guard space like they could previously.
I wanted to find out to what extent I could measure that. To give you a slight peek behind the curtain, working with the data available becomes a fair bit trickier when instead of looking at a single event you’re looking at a chain of events.
How many times does a team take a mark on the wing? Easy. How often do they score from a possession chain involving a mark on the wing compared to all chains? Again, easily done.
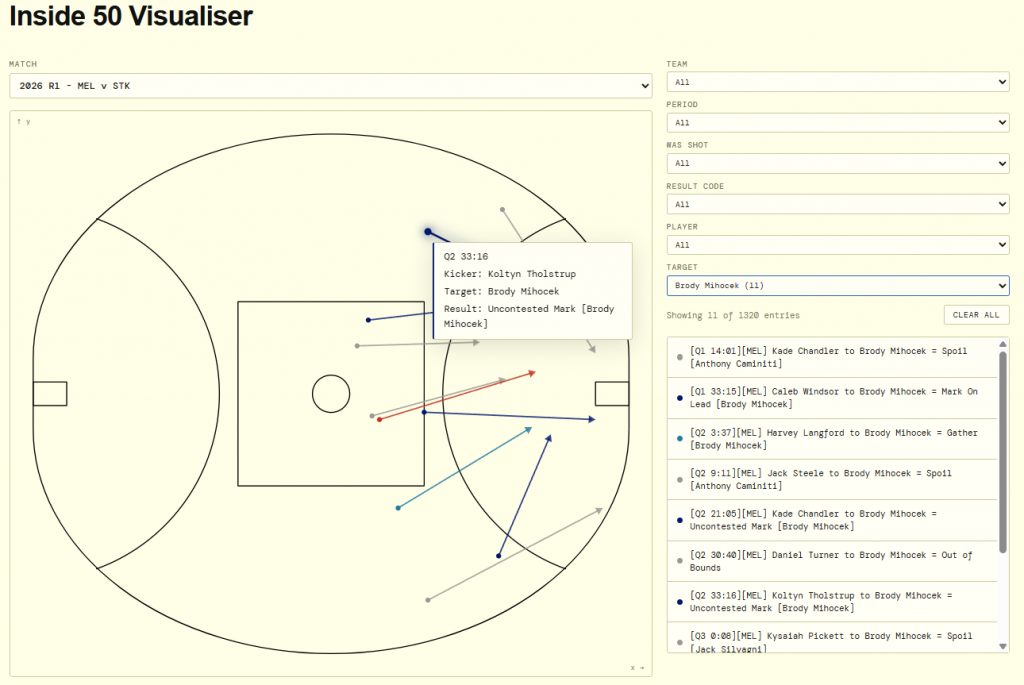
When you get into X happens, then Y happens, with Z result, it can start to be a bit complex. You can get caught out by edge cases in the data throwing up some weird results (not adequately accounting for an edge case is why I had a three week backlog of data for my inside 50 visualiser).
I wanted to see how well I could track these catch and release plays.
Imagine how excited I was when I ran the code and found that Sydney were off the charts for releasing a handball from a mark.
Sydney are, using a simple opponent adjusted points for and against model, the team of the season so far.
They’re also a really good handballing side (and there’s been a lot of talk about the importance of handball more generally). They handball a lot (top 2 for handballs per game), they handball effectively (top 5 for handball to handball receive) and they handball with purpose (top 2 for total handball metres gained and metres gained per handball).
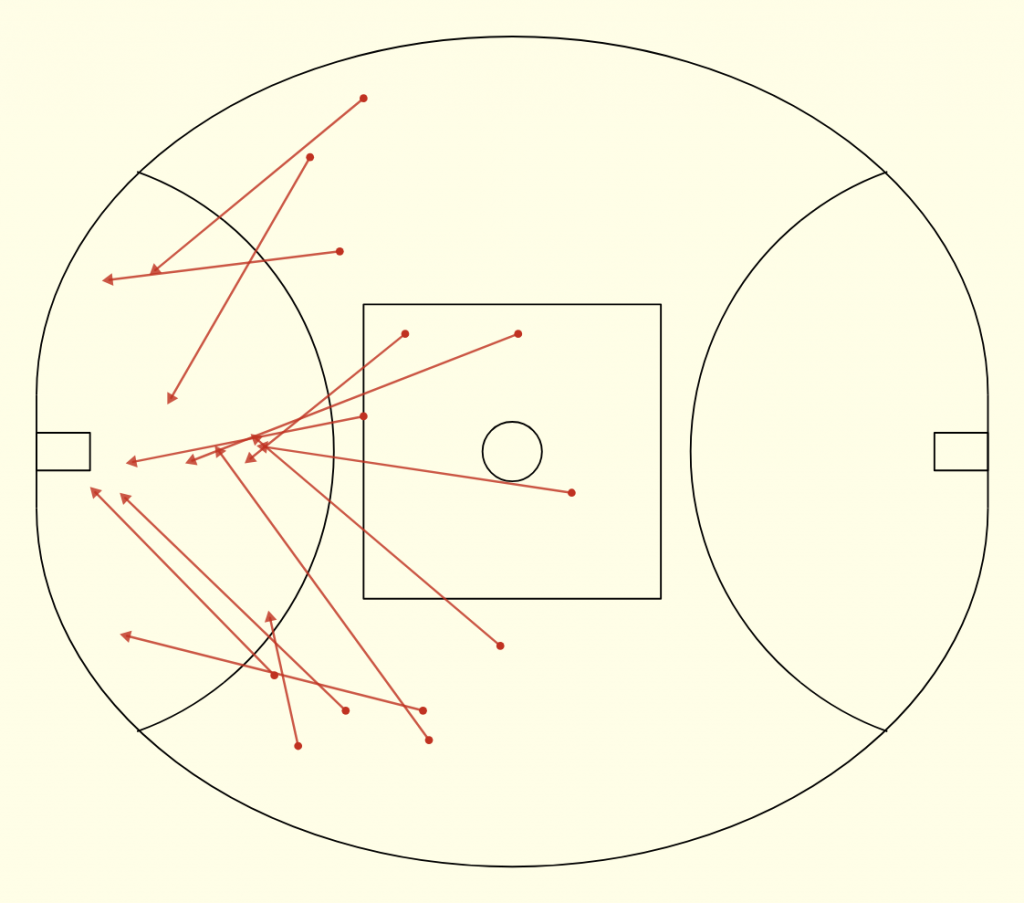
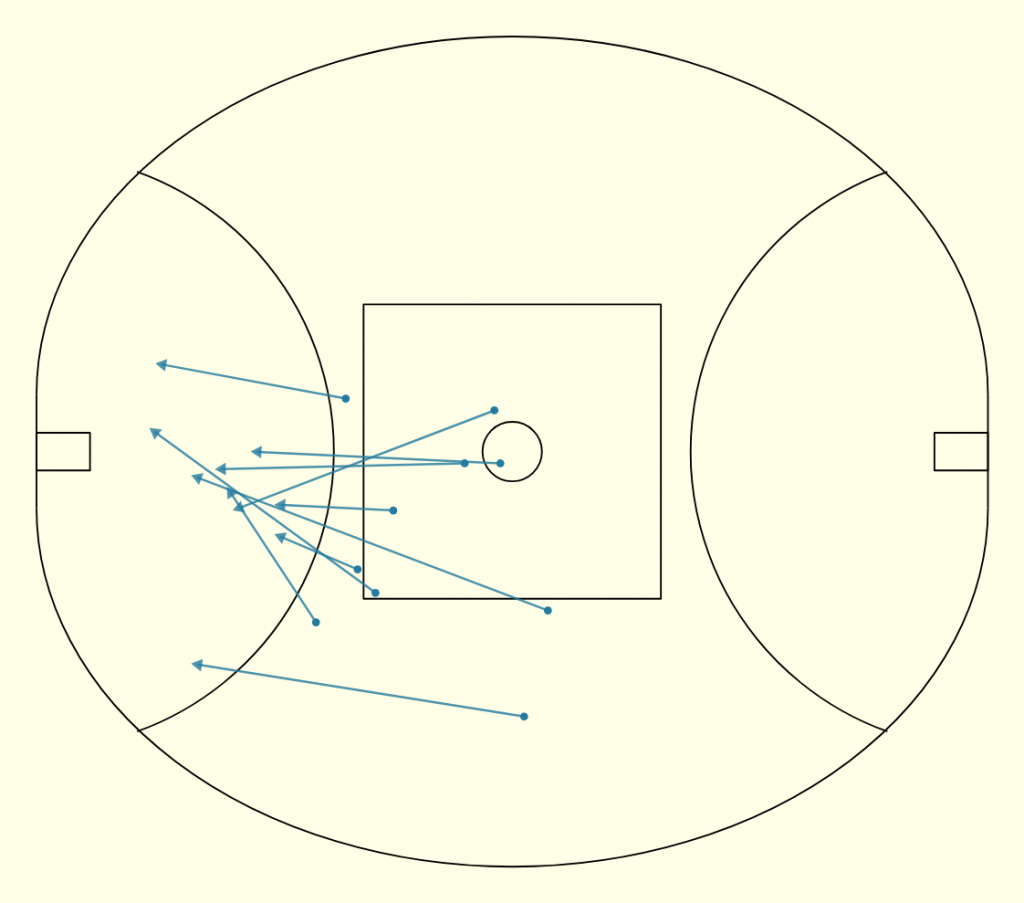
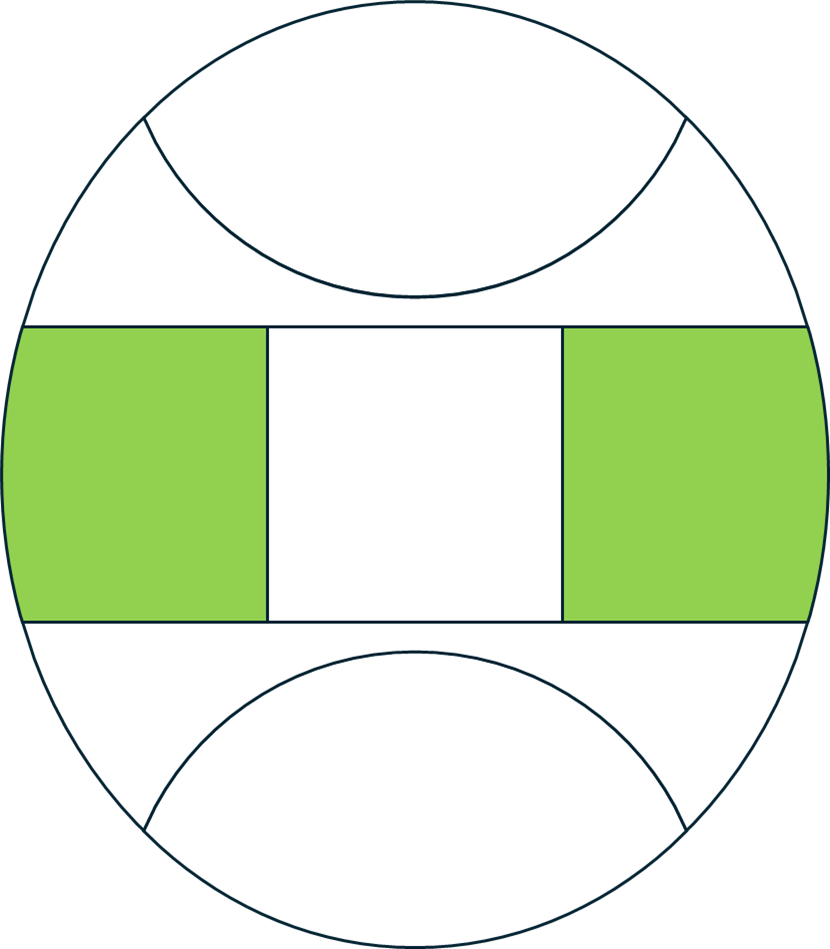
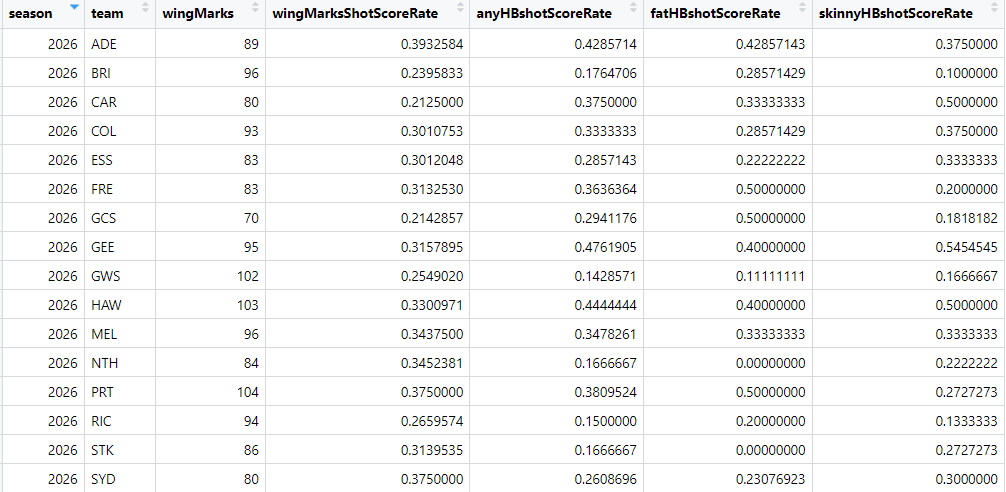
After a few iterations, the metric I landed on was a mark on the wing followed by a releasing handball to a teammate. To keep things simple I had a really simple definition of the wing – wider than the centre square, but within its length.
Now, an important note is that I wasn’t treating this as a cause and effect relationship – the handball on the wing opening up the opposition.I was looking for correlation though. Generally you’d expect a team to utilise this handball when there’s an opportunity to take advantage of a poorly positioned defence. The handball might help to facilitate that, but there’s a lot of selection bias going into when the handball occurs.
Sydney were releasing a handball from 23% of the time from a mark here, compared to a league average of 15%. I also wanted to differentiate between handballs towards the corridor (closer to the fat side of the ground) and towards the boundary (the skinny side). Again, Sydney were massively in front. 12.9% of the time they were releasing a handball to the fat side (9.9% to the skinny side).
I had a look at the change over seasons too (again, prior assumption being that the change to the stand rule may have influenced this)
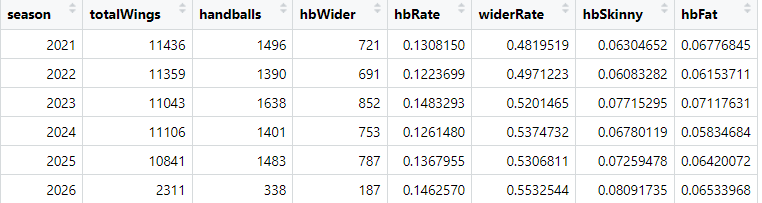
The rate of utilising a handball (hbRate) after these kind of marks was up, but a bit bouncy year to year. Proportionally though more of these handballs were going to the boundary side (widerRate) and this was a clearer trend.
I was moving towards wrapping up the article when I decided to take things a step further – are teams more or less likely to have a scoring opportunity when they release a handball like this.
(An aside: I prefer to use scoring opportunity rather than score to judge the outcome of a chain. It includes chains that either result in a score).
Looking at it over the past 6 seasons I ran into a problem.
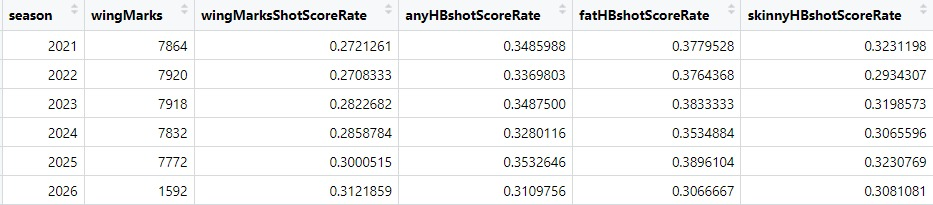
This year 31.2% of chains with a mark on the wing resulted in a scoring opportunity.
31.1% of chains with a mark on the wing wing followed by a handball release resulted in a score or shot at goal (a very small decline), and ones that involved a handball to the fat side (towards the corridor) were less likely to produce a scoring opportunity than those to the skinny side.
The numbers for Sydney in particular were even worse.
37.5% of all those marking chains resulted in a scoring opportunity compared to 26.1% where a handball was given off. Handballs to the fat side were going at 23.1% compared to handballs to the skinny side at a flat 30%.
I think there’s an interesting story to explore regarding the season by season and team by team figures. However with some work commitments I was running pretty late so I didn’t have the time to pivot to that.
I thought it would useful anyway to document a bit of the process I follow. Publication bias (only publishing where your research confirms your hypothesis) is a problem in science, I imagine it’s even more severe in less formalised areas like sports analytics. It’s a timely reminder to check your priors and to refer back to “what impact does this actually have” as a touchstone for what’s real and what isn’t.
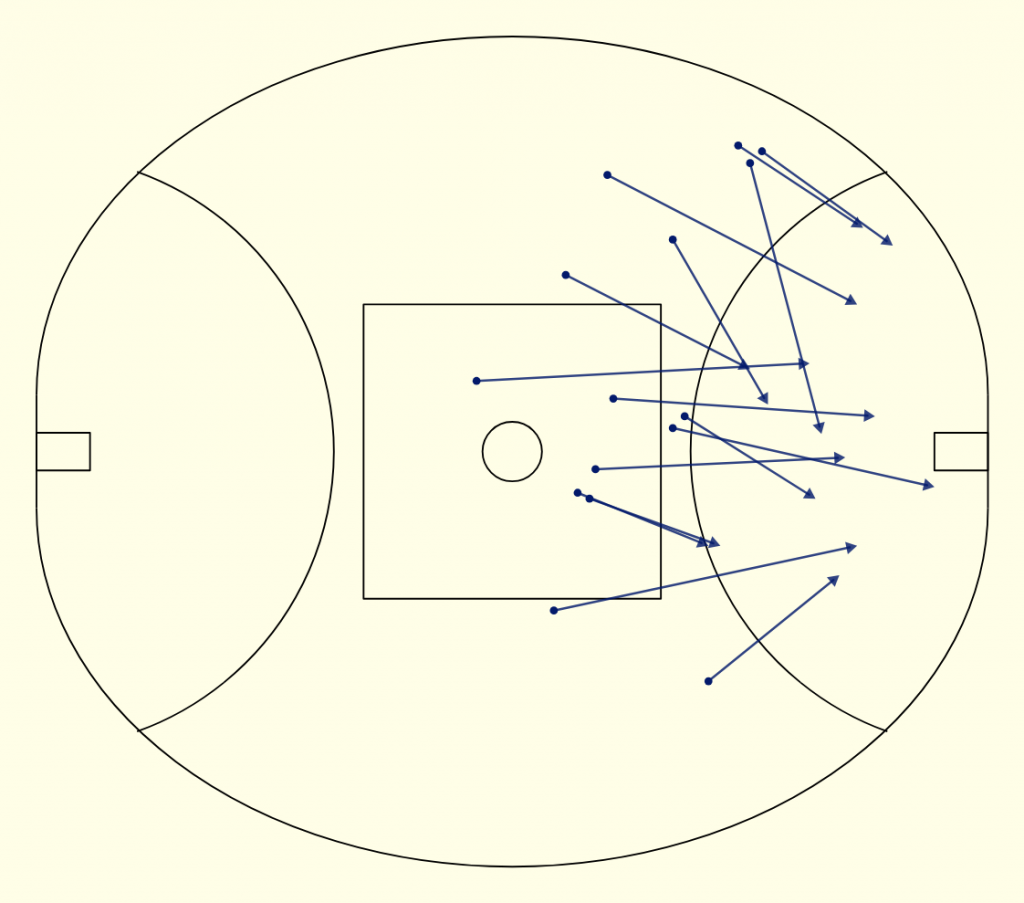
In the meantime, have some trivia I uncovered about the higher profile handball – taking a mark from in or near a scoring position and dishing it off to a teammate to have a ping.
[These stats are a bit more prone to error, as you take into account inside 50s and shots on goal there’s more variation in the data – does it record a contest target, how does it record the inside 50, etc. I’m less worried about that given this is purely for trivia, but if you uncover dusty footage of Harry McKay giving off a handball in 2021 please don’t yell at me]
Since 2021 Harry McKay leads the league for most times taking a mark in a scoring position without ever giving the handball off to a teammate who takes the shot.
The top 5 is rounded out by Peter Wright, Jamarra Ugle-Hagan, Kysaiah Pickett, and Sam Darcy.
Jesse Hogan and Matt Flynn have shared it around more often than any other players in the same period.
Overall this season has seen it decreased to 3.3% of opportunities, part of a relatively steady decline from 4.4% in 2021.
Of those benefiting from the give off Jeremy Cameron leads the way with 22 at a goal rate of 54.5%.
Behind him are Mason Redman (19 at 36.8%), Dan Houston (17 at 41.1%), Jordan Dawson (15 at 46.7%) and finally Kane Farrell (13 at 38.5%).
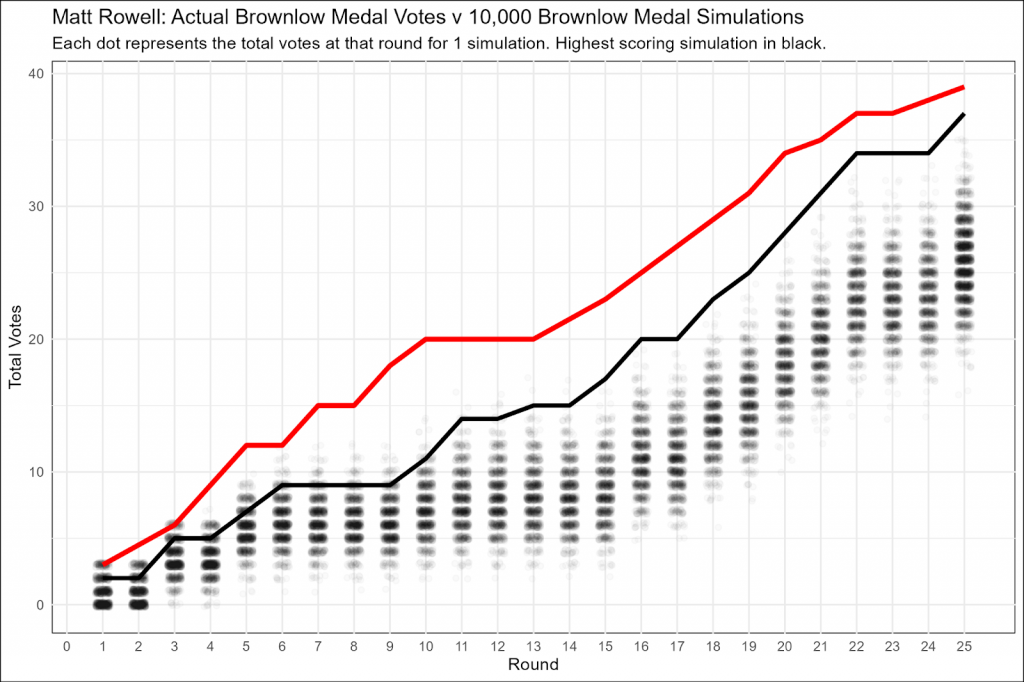
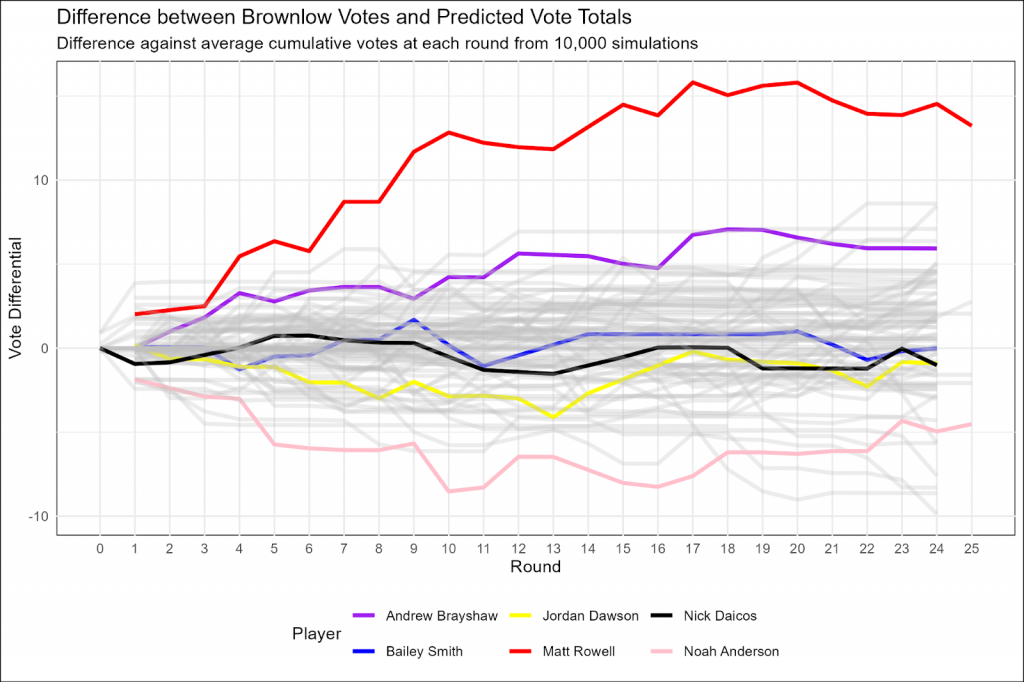
Nick Daicos as Derek Jeter
If you haven’t heard already, Nick Daicos played his 100th game this week.
An AFL.com.au journalist even had the absolutely insane job of trying to rank his first 100 games. There is no doubt that Daicos is one of the better players in football right now. Ranking players is somewhat of a fraught exercise, but many have Daicos within the best three players in the game right now. Your scribe doesn’t love ranking players, but that might be a little high in our eyes.
The spotlight Daicos draws by being the most famous name in the most famous team in the league is undeniable. Which made me think of Derek Jeter.
Jeter was unquestionably one of the greatest players of his era, a near-unanimous Hall of Famer who won five World Series with the most famous baseball team ever. Jeter was known for making the big plays in the big moments on the biggest stage – a bit like the rep Daicos has built over his time in the league.
Jeter was a player built for the highlight reel, with seemingly sensational plays being made day on day.
But highlights can sometimes be deceiving. This is where the Jeter comparisons are useful. For much of his career Jeter was considered one of the best defenders in baseball at its hardest infield position – short stop.
Across his career he won five Golden Glove awards for being the finest defender in his league at his position. Jeter was known for his jump throw, a highlight reel worthy put out that was regularly cut up into sizzle reels to advertise the game.
This is the juicy stuff – the stuff that gets fans through the gate.
It was also symptomatic of why Jeter was one of the worst defensive baseball players of all time. Sport is often about making the spectacular look routine (head nod to Wemby), but Jeter’s style often meant the routine plays were missed so all we were left with was the spectacular.
Jeter’s style often impacted the substance.
Jeter ranked relatively highly in one of the only early defensive measures – fielding percentage. Fielding percentage looks at the number of chances converted against errors. It does not look at how many plays that you miss due to speed, range and poor positioning – Jeter’s relative weakspots.
Stitching together the two advanced (and more complete) defensive metrics Jeter gave up more than 200 runs with respect to his defence – the worst infielder of his era.
This is where everyone gets angry while reading this, especially after one of Daicos’s finest quarters so far.
Daicos’s biggest value at this point may be the style with which he performs and the amount of time he accumulates with the ball. The disposal numbers are often high, and the highlights are plentiful.
Disposal numbers have little value or meaning in modern footy (we don’t have time for that deep dive here), so let’s look at the other side.
There are few players that look better in a highlight reel than Daicos, especially when he is allowed space to pick a target out by foot.
Daicos’s running ability means that he can usually burn off any opponent that sits behind him and beat him to the next contest (or for a handball receive). Collingwood’s system has been designed to open up as many opportunities as possible for their second layer mids and outside users – like Daicos – to impact the game.
But (most of) the other teams in the league don’t rest on their laurels, and that biggest asset has become potentially a weakness.
For the first three quarters Carlton largely negated Daicos’ influence, and Collingwood ability to go forward and score. But Carlton’s extremely intensive defensive method (written about here) is unsustainable across four quarters. It means that every week they lose their defensive shape from lack of communication, energy and variety.
Daicos is nearly the perfect player to exploit these weaknesses. Daicos is an excellent runner, especially with defences trailing him.
But even with this excellent performance, Daicos has not been what many think he is this year.
Daicos is sitting near the bottom of all players when looking at the percent of ball retained when kicking inside 50. There’s filtering here for his rough role (using clearances, hitouts and raw kick numbers), but even when expanded he is close to the least effective kick inside 50 this year in a raw sense.
Even in that last quarter there were loose kicks going inside 50, especially when confronted by any pressure from ahead of the ball.
Last year Daicos was closer to league average, but still below the break even mark. This aligns with how defenses have changed to play against him, and make his life harder.
The Kick Retention and Threat measures (as developed by Liam Crowhurst) paint a similar picture.
Part of this is the type of kicks that Daicos increasingly tries to bite off. Like Jeter, Daicos seemingly has a flair for the spectacular over the simple, making life harder for himself. Back in 2023 and 2024 Daicos rated far higher on these measures, and his kicks were largely more…measured.
In 2024 his average kick distance was about 25m, with that distance increasing to above 29m this year. In that year his retention rating was above water, and his kick inside 50 retention rate was one of the better ones for volume users.
While Daicos isn’t the only Collingwood player who uses the ball, his decline is emblematic in Collingwood’s scoring issues since 2023. Their defence is stellar, but their use going up the ground is deliberately chaotic and often poor.
This is just looking at what we consider to be his strengths. There aren’t great defensive metrics that exist for individual players in football, but Daicos is a player opposition teams have tested going the other way.
It’s not his job to defend hard away from contest, but when I’ve seen him live that side of his game is noticeably less developed. Some of the other names in his vicinity on the charts above are more known for their defensive sides of their game.
Some footage I’ve seen has shown opposition sides running players targeting his usual reception zones, or to run off him completely. This is nearly the opposite of a tag – forcing him to be accountable the other way.
This defensive side is largely unaccounted for in metrics like the AFL Player Ratings, so is hard to specify in a concrete manner.
There’s other prominent names that ping on some of the numbers above – most notably Pickett and the Bont. But both those players are more versatile and more able to provide value without the ball. If the Bont isn’t hitting kicks up the ground, he can play as a deep forward or a spare behind the play. Pickett can isolate opponents up forward.
Daicos doesn’t have the same level of positional flexibility – he often gets deployed loose behind the ball but more in a designated user sense instead of a defensive role.
None of this is to say Daicos is a bad football player. That would be heresy. He provides significant value in his mere presence in how he forces opposition teams to adjust. When he is on, he can absolutely break games open (like last Thursday).
It’s very hard to evaluate players in one look – either live or on TV. Footy is a expansive game with a very high number of contributors. Much of a player’s game happens away from the ball, which makes it even harder.
As a result it’s easy to be seduced by the highlights – something that’s usually a mistake. Even someone like Shannon Brown can look an MVP with the right editing.
He might not be in the “greatest first 100 games” argument (that’s Haydn Bunton pretty comfortably), or the debate about the best five or ten players in the game right now (don’t make me list them).
Jeter is still a Hall of Famer, and was probably robbed of a MVP trophy. Daicos is still an absolute force when on.
But he isn’t the guy we think he is (right now, or anymore).
(Retained) Possession is Nine Tenths of the Law
Being a Carlton supporter over the last three decades has been painful. Last night was yet another example of this, going down in yet another fourth quarter comeback to a side that simply ran over the top of them. But a hallmark of the Voss era has been an overemphasis on defence, at the expense of being able to move the ball effectively. Carlton are second in the competition this season for rebound 50s per game, at 45, suggesting that the defence is somewhat resilient. The problem is that the ball just comes straight back, Carlton are league worst at inside 50s conceded per game.
As mentioned above, for Carlton, part of the problem is ball movement, with the team struggling to retain the ball once it clears it from defensive 50. It has the worst transition rates to F50 and to scores when transitioning out of defensive 50.
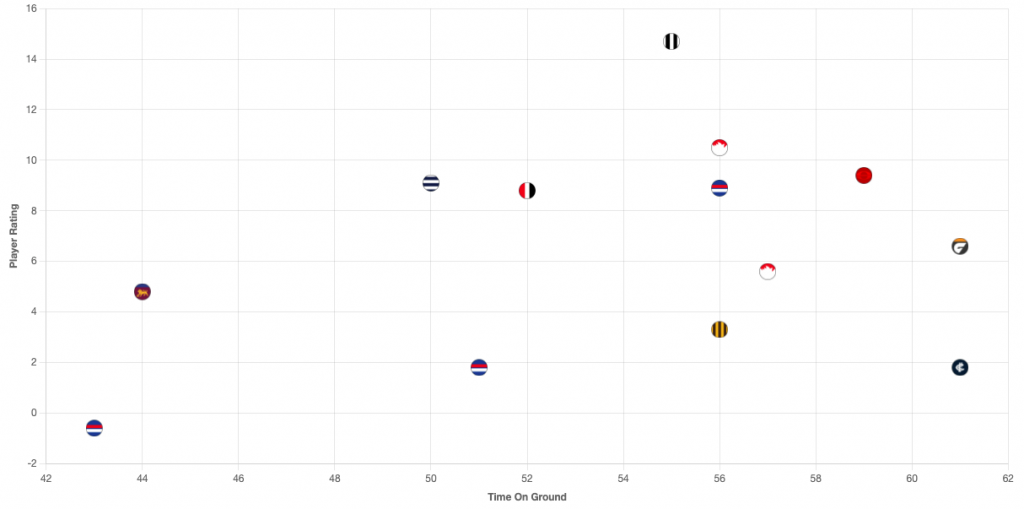
While Adelaide has far better returns in terms of points generated from the defensive half (37 per game), and has had a much tougher schedule to date, it profiles similarly to Carlton in ways that are worth keeping an eye on. Crucially for Adelaide though, it has a pair of weapons to help it improve its transition rates in Worrell and Milera. The pair are right up at the top of the competition in terms of retained meters gained, offering multiple reliable pathways out of defence.
GWS are right up the top for transition rates from D50 to F50, led by the top player in the competition for retained meters gained, Lachie Ash. Ash is the only player to top 400 meters retained per game, retaining around two thirds of the territory he gains per game, and he has added almost 100 onto what he was doing last season.
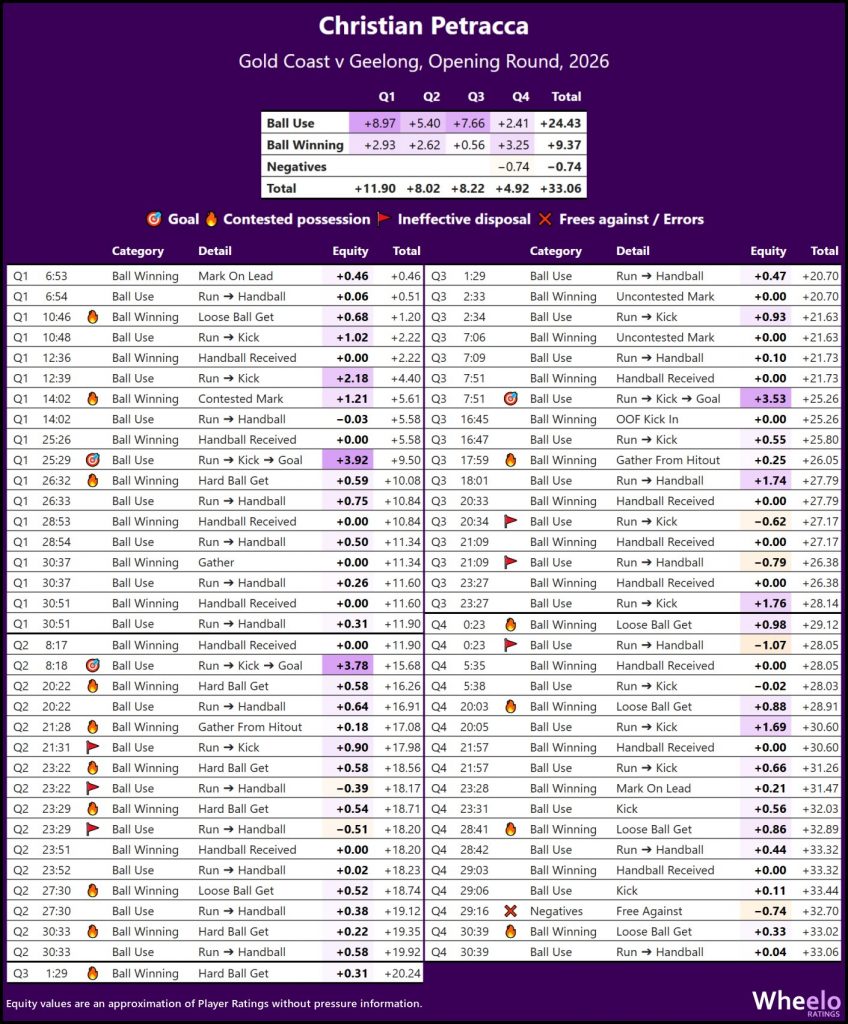
While the 300 (meters retained per game) guys are mostly defenders, there are 5 midfielders taking plenty of grass and keeping a fair bit of it. Petracca will provide a welcome return for the Suns this week after his blistering start to the season, although it will be interesting to see if he can keep up the efficiency levels he started with, given it was a weakness for him during his last year at Melbourne.
While Bailey Smith has often copped criticism for his at times wayward disposal, it is interesting to see Nick Daicos as somewhat poor for retention, retaining less than half of the meters gained. While Daicos was the difference against Carlton on Thursday night, given how central he is to how Collingwood play, his retention compared to meters gained may be something that needs to be addressed if Collingwood is to challenge the better teams this season.
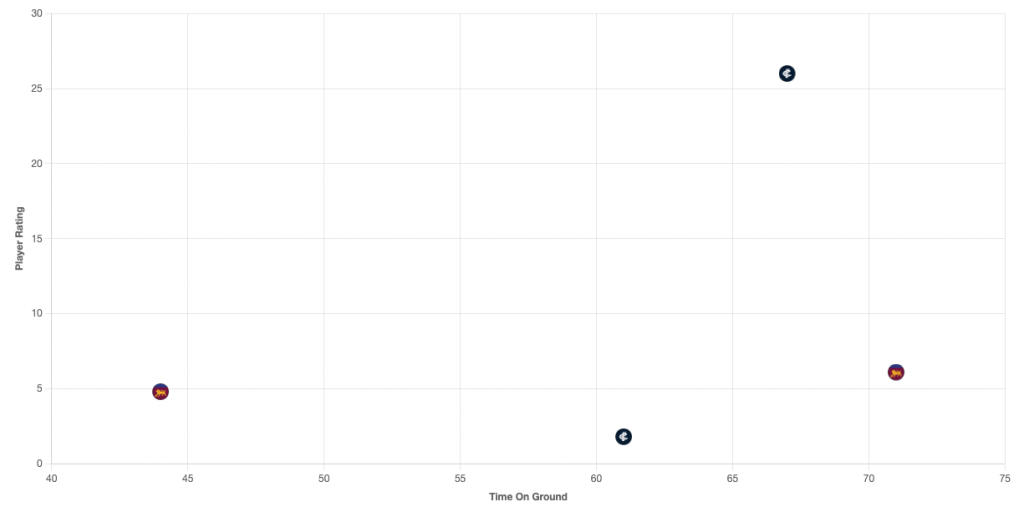
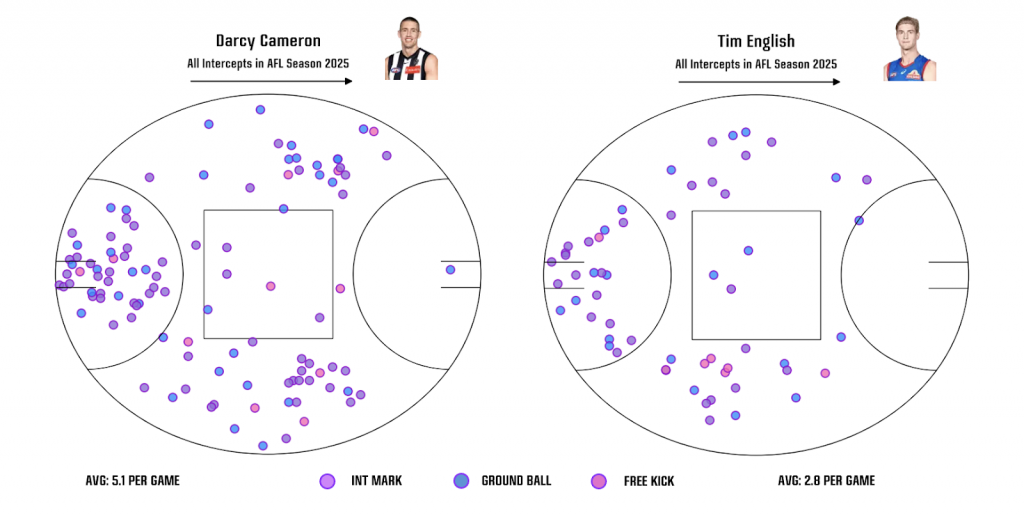
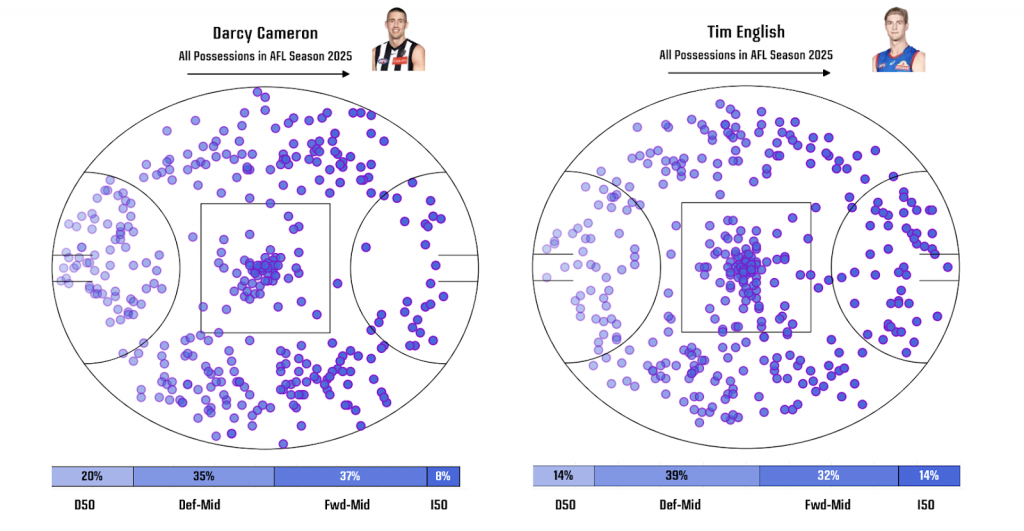
Shifting to look at who is at the top of the other positions highlights the gap between the different roles and the utilisation of different ball users. Perhaps unsurprisingly, the rucks are the lowest grouping for retained meters gained, with the currently injured Tim English leading the way there with 130 per game. Shoutout to Tristan Xerri who averages 21 meters retained per game but still manages to be in the top 10 players in the competition for player ratings.
It seems that no one has adopted the adage of good kicking is good football quite like Hawthorn, who have a great spread of quality ball users across the list. Looking at the forwards signals to some of the engine driving the potency of the Hawks forward line, and shows just how valuable the pair of Connor MacDonald and Jack Ginnivan have been at moving the ball for Hawthorn this year. They are two of the top three forwards at retained meters gained, and both are in the top 20 in the competition for score assists.
Another week of starting out with something Carlton struggle at, and transitioning to something that makes the Hawks so good. How grim.