• Round 23, 2025

    Round 23, 2025

    This Week In Football is a collection of some of the best in football currently outside the walls of AFL clubs or broadcasters. Each week a curated grab bag from regular contributors and special guests will provide insight into and beyond the game on subjects of their choosing. For more about our contributors, click here.

    Banner images by Polly Porridge of the True Bloods Podcast. Check out her other design work.

    Before the Bounce

    There’s hype, then there’s this.

    Friend of TWIF Len Phillips found one of the weirder articles written on a AFL club website in recent years. Here’s a sample of it:

    TWIF can’t link you to the whole article because it has been nuked from the Lions website this morning. It is a wild ride of alleged bias and player acclamation. Luckily, it has been archived here.

    The article is somewhat emblematic of the race for AFL awards at the end of the year. In order to win many of the major panel-decided awards, clubs develop packs of support for nominated players. It’s arms length, but to best support the interests of fans and their players, clubs have to do a job in selling the strengths of each player.

    But that article is beyond that – a few steps past that line.

    Peter Blucher wrote that article, and one with a very similar tone about the snubbing of Harris Andrews from the All Australian team.

    That name may sound familiar to diehard, slightly older footy fans. The AFL Queensland Hall of Famer has had a long involvement in the game, from journalist to club media manager and finally player agent.

    It’s that last stop that was the one that drew the most public attention. In 2013 Blucher was suspended for a year for his involvement in the Kurt Tippett scandal, which caused Tippett to be suspended for half a season as well.

    That case was the linchpin on a crackdown on the behaviour of agents as well, although the actual face used for the crackdown was that of Ricky Nixon.

    It also wasn’t the last time his behaviour was questioned. In 2015 GWS asked for an investigation into his conduct relating to a hip operation on Adam Treloar around the time he was traded to Collingwood.

    A few years on, The Age’s Daniel Cherny broke the story around the alleged reasons around Joel Wilkinson’s failed return to the AFL. Blucher also features prominently in that one.

    This is all somewhat a distraction from the real issue – namely whether Ashcroft is in the mix for the Rising Star. Time will tell if that blank website can sway the voting panel.

    This week in football we have:


    How each AFLW side has been constructed

    Emlyn Breese / CreditToDuBois.com

    With Season 10 of the AFLW launching this week I wanted to have a look at how the 18 squads for 2025 have come together.

    There are 22 players still with their original Season 1 clubs, and each of the founding clubs has at least one original player – Adelaide having the most with 5.

    Carlton have made the most new additions for Season 10 with 10 new players – only one of whom comes from a previous club (Tara Bohana having played 31 games for Gold Coast).

    Brisbane have made the fewest changes with just three additions to their list – Neasa Dooley, Lilly Baker, and Claudia Wright all new to the AFLW.

    Melbourne have the most homegrown talent with 27, while Richmond and Essendon have the most players with prior club experience at 17.

    Essendon and Carlton both enter the season with 10 players yet to play a game for the club (Sophie McKay, Poppie Scholz, and Tara Bohana all played in the opening match of the season, so Carlton are already down to 7 uncapped players).


    AFLW State(s) of Origin

    Sean Lawson

    This is not an article about state of origin football, but rather a bit of a chart dump about where the current players in the two AFL leagues come from.

    So to start with, here’s how that looks. Thanks to Emlyn for supplying AFLW data to which I applied states of origin, while the AFLM data is slightly edited state of origin data from Fanfooty

    The most notable difference between the two leagues is that Queensland is, pretty simply, not a development state in the women’s game. There’s almost as many Queenslanders as Western Australians in the AFLW, buut there’s nerly 4 times as many Western Australians in the men’s league. 

    Queensland is not a part of the “Allies” at the girls’ under 18s championships but competes solo, finishing second in the standings this year.

    NSW and the ACT are also relatively better represented in the women’s game, which is in line with higher participation rates in adult women’s footy in the northern states.

    Western Australia’s relative lag is interesting here, and this may paint a picture of a relatively struggling women’s game out west. I noted with interest an interview with Canberran Swans player Lexi Hamilton, who described their recent star Western Australian recruit Zippy Fish as “raw” in coming from Perth instead of the development pathways in Victoria.

    The stronger women’s presence in NSW is especially the visible with regards to players from the north of the Barassi Line. A majority of male NSW AFL players (27 of 44) are from the south and west of the state, in line with the traditional strength of the Riverina and Murray regions and centres like Albury and Wagga. 

    By contrast, a large majority of NSW women in the AFLW (30 of 38) are from Sydney, or otherwise coastal or northern NSW. Riverina women’s football has been less developed until recently compared to, say, AFL Canberra, and most current AFLW players from southern NSW were recruited through intermediary periods playing in Canberra or Sydney.

    Unsurprisingly, the big states who play lots of football produce the most players, and when we convert over to per capita terms, the usual suspects predominate.

    Northern and southern NSW are shown separately here to give an indication of that traditional productivity below the Barassi line, where the Murray region is every bit as productive in men’s footy as Victoria itself.

    Also notable here is Ireland, not a state of Australia, because the roughly 7 million people in Ireland currently have produced the same number of current AFLW players (38) as the similarly sized New South Wales.

    With such a lopsided talent balance across the country, one of the big points of difference for clubs is how many locally recruited players they have. 

    Overall, AFLW squads are generally from closer to home, which is a product of the state-based drafting across the history of the league until last season, where clubs often could not recruit interstate players at all. The lower payscale and short contract periods also made making long distance moves less feasible until very recently when pay (now 60k to 100k in four tiers) started to get into “living wage” territory.

    Only three clubs – Hawthorn, Essendon and Geelong, have a more local squad in the men’s competition than the women’s and the Hawks stand out for having the highest percentage of Victorian players in both the AFLW and the M.

    In line with Queensland’s much stronger women’s footy presence, the situation for Brisbane is completely inverted between the two teams, with one of the highest local content factors on its women’s team and one of the lowest in the men’s.

    In the AFLM, every Victorian club has more locally recruited players than every non-Victorian club, and the four clubs in NSW and Queensland all found over 70% of their playing lists in other states.

    On the AFLW side, North have the most international players, but with a strong Irish contingent taking professional opportunities on our shores, only four clubs lack any overseas players at all.

    Essendon has the most Tasmanians right now, with the likes of Ellyse Gamble and Daria Bannister probably on the phonecall list for the Devils in a couple of years.

    Away from their home states, Port Adelaide is a hotspot for Western Australians like Gemma Houghton and Abbey Dowrick, St Kilda has a contingent of Queenslanders including Jesse Wardlaw, and Richmond has a number of NSW/ACT players

    In the AFLM, both Carlton and Collingwood have lots of South Australians and the Dees, Dogs and Kangaroos all have 8 Western Australians. The Crows, partly with their Broken Hill connection, have the most NSW players away from Sydney.

    Finally, on the types of players recruited from different states, it turns out clubs are more interested in scrounging up talls from non-traditional markets such as Queensland, with over a fifth of all Queensland players being of the two metre variety, compared to 11% in the league as a whole.

    Men over 200cm tall are exceptionally rare and sought after by all sports. The AFL has pursued entire pathways in US college sport just to source more meat for the ruck grinder. 

    Oddly enough, South Australia has 17 men over 2m tall playing in the AFL compared to the larger Western Australia having just 11. TWIF’s own Joe Cordy has proffered the theory that the constantly successful Perth Wildcats are monopolising Western Australia’s limited supply of tall buggers, leaving the AFL coming up a bit short, and I am not going to argue with this assessment.


    King’s working forward in different ways

    Cody Atkinson

    There’s been a bit of a debate occurring through different parts of the footy community, particularly the one existing online and in talkback spaces. It centres around Ben King and what makes a forward valuable.

    Firstly, a tweet in minimal context (and a shout out to ESPN and what they do in the footy space – this isn’t intended as criticism or shade, just an example).

    This is indicative of the thinking – if a forward like King is just getting shots on goal and providing nothing else by foot, is he doing enough to be considered valuable. Are Gold Coast getting enough off a player as dynamic as King if all he is doing is getting shots on goal?

    This hits at an issue that Sean Lawson and I have explored in part before, but in relatively disparate ways – the lack of homogeneity of jobs across the ground, and the hidden parts that make players valuable.

    In short, not all tall forwards in a team are asked to play the same role, and not all tall forwards across the league are tasked to do the same thing. 

    In fact, it’s a question that we’ve asked AFL coaches over the past five years. Almost universally, it’s not goals or marks that matter the most, but instead playing the team role and competing. Here’s Dean Cox explaining what’s important from earlier this year:

    No – the competing part and getting the ball to ground (is the most important). So say a player takes two or three contested marks in a game – it’s a pretty good game you know. But the difference between not losing them or at least having them is really important because we want you to get the ball to ground. 

    “You want to be dangerous in the air and at ground level. The forwards are aware that it’s not just about their contested marks they take, it’s about how many times the opposition take it on us and we don’t get an opportunity to get inside and score from that.

    Without being in the huddle with Hardwick, there’s a fair indication that the job being asked of King is very different to that of other key forwards. Hardwick’s teams, whether yellow and black or red and red, have tended to anchor players deep to stretch defences.

    As footy has evolved it has become increasingly congested – vertical spacing forces defences to either leave dangerous players unattended or leave room for dashing runs and leads. Richmond used to isolate Martin, Riewoldt and Lynch, while King and Long seem to be the main options on the Coast so far.

    This chart shows the top 20 goalkickers this year in terms of total marks and the average distance from goal that their marks were taken. You’ll note that King is almost 30m per mark closer to goal than a player like Riley Thilthorpe. It’s a similar story when you break it down by contested marks too – King does his work deep, as he is asked. He’s also been one of the best talls at winning ground balls inside 50 – of that list of 20, only Jack Higgins has won more per game.

    He’s also one of the most clearly targeted inside 50 this year. Only Mitch Georgiades has been targeted more in total (noting potential issues with the data). When they’ve kicked it towards King when going inside 50, the Suns have been able to rack up 326 points – the most of any respective forward/team relationship in the league. This has come at the cost of raw efficiency, but sometimes there’s a place for raw volume as well.

    King is doing those little things right – maintaining space, providing a contest, preventing rebounds. Beyond his actual goal totals, he’s providing that focal point necessary for the Suns to start actually climbing up the ladder. We know that King can play higher up the ground and contribute more, as he’s done it before. But that’s (likely) not the job in front of him right now.

    The shift appears to have worked for the Suns. They’ve gone from having the second worst rate of generating scoring shots per inside 50 to ninth in the league. They’ve also gone from being one of the worst sides at allowing sides to march from their defensive 50 to attacking 50 to one of the better teams. The Suns are also generating the deepest contested marks of any side on average of any team, providing a clear indication of how they try to attack the field and protect on the way back.

    So let’s loop back to the question above – is King doing enough? The natural reaction might be no. But given how much better the Suns have been going forward (and the role he has played) the answer is likely yes. 

    More precisely, due to the difficulty of assessing how players are actually operating in different systems and how they contribute to success, we probably can’t get closer than “maybe”.

    Which would be the second most unsatisfying way to finish the article.


    The adjustment that could win the Western Bulldogs the Flag

    James Ives

    As the top nine AFL clubs prepare for one of the most even finals series in recent memory, the smallest improvements can be the difference between a first-week exit and a place in the Grand Final.

    At this stage of the season, dramatic transformations are rare. You are what you are. Health remains the most obvious factor in any late-season surge, but more subtle edges can be found in detailed opposition analysis, targeted role tweaks, and exploiting specific matchups.

    For the Western Bulldogs, their weaknesses are there for all to see. Opponents can exploit matchups in their backline, and their aggressive press leaves them vulnerable in transition.

    Luke Beveridge has experimented with solutions, such as redeploying their spare across different lines and adjusting the way they use their wings, but the problem is stubborn enough that some fans have resigned themselves to hoping the Dogs can simply out-attack their opposition.

    But perhaps the answer is simpler than it seems… 

    A small role adjustment for one of the AFL’s elite rucks, inspired by Collingwood’s use of Darcy Cameron.

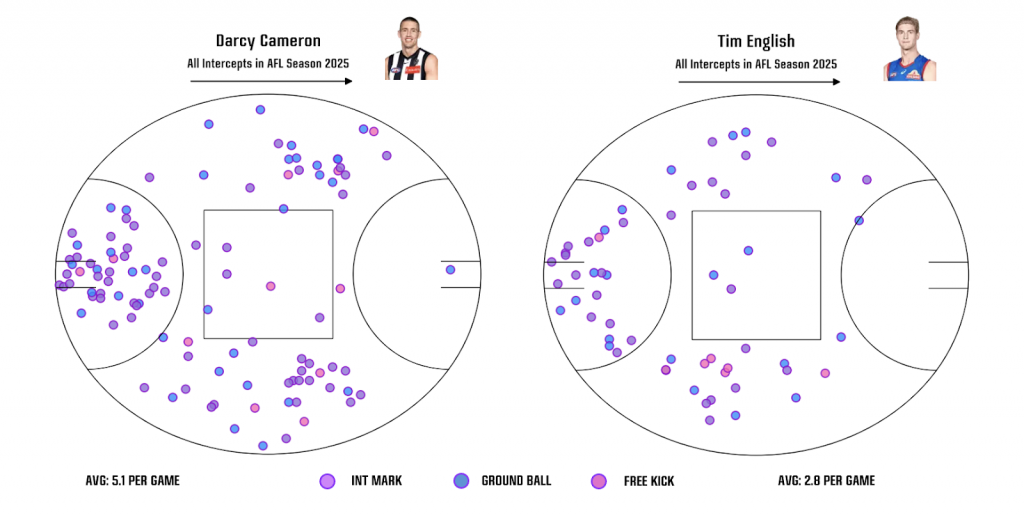
    Tim English is far from a defensive liability. He averages 2.8 intercept possessions per game (6th among rucks) and 1.4 intercept marks (4th). He’s also kicked 13 goals this season, ranking 2nd in total goals for ruckmen. The issue isn’t what English lacks, it’s that he’s too balanced.

    The Bulldogs’ real problems lie in defence and transition. They don’t need their ruck drifting inside 50 to compete with Aaron Naughton and Sam Darcy. They don’t need him functioning as an extra midfielder on the spread. They need him prioritising defensive positioning and lending consistent support to an underweight backline.

    Cameron offers the blueprint. He positions himself behind the ball at all costs, rarely caught in between his opponent and his defensive responsibilities. This often places him in prime spots to intercept on the flanks and across defensive 50. English, by contrast, tends to generate most of his intercepts deeper inside defensive 50 or along the back flanks. Less proactive, more reactive.

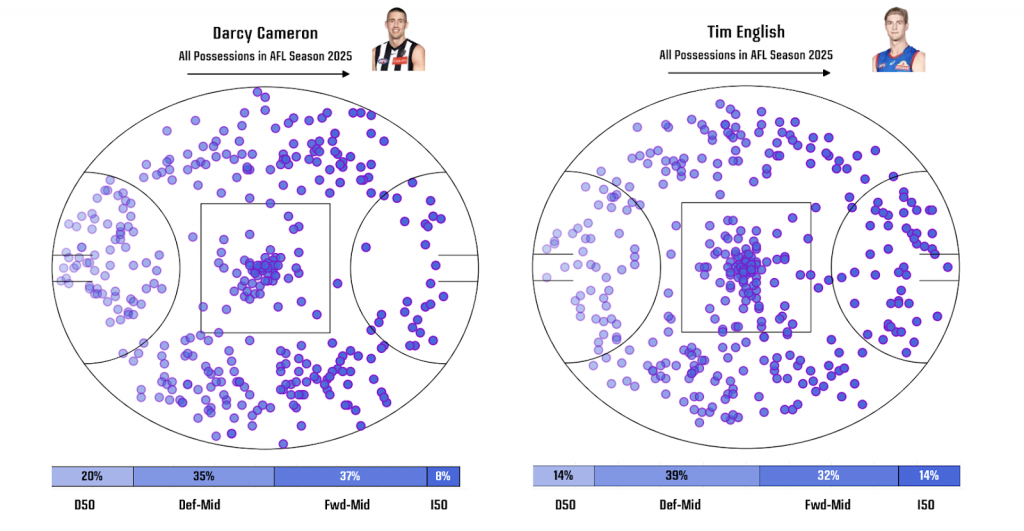
    Possession heatmaps tell the same story. English gathers 14% of his disposals inside forward 50 and shows a higher concentration through the corridor compared to Cameron

    His mobility makes him a genuine asset around the ground, capable of presenting as an option forward or tracking back to defend. It’s his greatest weapon. But when deployed more like a pseudo-midfielder than a pseudo-key defender, it can create problems. 

    Take a look at this Melbourne transition on the weekend. After losing a post-clearance ground ball, Melbourne transition through the wing. English works back to support but is pinned to the boundary after an aggressive back-45 lead from Tom Sparrow. As Jack Viney is held up, English stays pinned to the boundary instead of switching and repositioning himself into the dangerous space. Viney attacks the hotspot, drawing the Bulldogs’ defenders towards Max Gawn, and Melbourne have just enough coverage to crumb and score through Harrison Petty.

    In finals, where margins are extremely fine, the Dogs can’t continue to be exposed inside defensive 50. By adjusting English’s role to mirror Cameron’s, sacrificing some forward forays for consistent defensive positioning, the Bulldogs could address their most glaring weakness without overhauling their system. In a finals series this even, that single tweak might just be the difference between another year of frustration and winning the flag.


    Around the grounds

    • Here’s another plug for the W Download podcast by Sarah Black and Gemma Bastiani, which now has all 18 teams previewed in its recent back catalogue. A must to know what to expect  from each team  this season.
    • Ever see a scorpion kick goal kicked by a player jumping for a hanger? Now you have.
    • On The Shinboner, Ricky Mangidis breaks down how Collingwood have used Dan Houston away from his former role, Carlton’s two gameplans, and Geelong’s use of the Jeremy Cameron attention.
    • The latest Footy A2Z video is about how the rules of the game looked back in 1859. Footy A2Z is a youtube channel with simple informative animated videos about the game’s history and mechanics.
    • Squiggle Football is out! This is author and footy analyst Max Barry’s AFL deckbuilding football management roguelike and it’s pretty good.
  • Round 22, 2025

    Round 22, 2025

    This Week In Football is a collection of some of the best in football currently outside the walls of AFL clubs or broadcasters. Each week a curated grab bag from regular contributors and special guests will provide insight into and beyond the game on subjects of their choosing. For more about our contributors, click here.

    Banner images by Polly Porridge of the True Bloods Podcast. Check out her other design work.

    Before the Bounce

    Every year football tends to enter a slight hibernation period in the middle of winter before awaking anew as spring slowly starts to poke its head around.

    With just four weeks left the season is very much alive, with some of the finest games of the season being fought out by finalists (think Collingwood v Fremantle) and non-finalists (St Kilda v Melbourne) alike.

    The race is on for most spots that matter – from the minor premier to the last finals spot. While there’s a couple of win break to tenth and eleventh on the ladder, sides right through to 14th have shown at least moments of brilliance.

    But some have claimed that the season has been dull, ignoring much that we’ve observed on the field. Despite renewal at the top end of the ladder and a fair amount of tumult as the season has progressed, there hasn’t been enough for everyone.

    Perhpas some of this is down to the lower number of truly close games than the last couple of seasons. Average game margins are up 2.5 points per game on last season. In addition, the number of games decided by less than a straight kick is down to 10% from last year’s 19%.

    But it’s worth noting how unusually close the past four seasons have been. Normal can sometimes be skewed by the extraordinary. And while there are fewer games that are extremely close, there are more than normal that are very close.

    And things only seem to be getting tighter week on week.

    As a famous philosopher once said: strap yourselves in.

    This week in football we have:


    Breaking Down Brisbane vs Collingwood

    James Ives

    It started with a deep intercept mark in defensive 50 by Harris Andrews, followed by six quick-release kicks to uncontested marks as Brisbane sliced through the corridor. Callum Ah Chee then found space inside 50, setting up Logan Morris to assist one of Henry Smith’s three goals.

    It was a stark contrast to the Easter Thursday match-up at the Gabba, where Collingwood’s defensive dark arts were on full display. They forced Brisbane wide at every opportunity and preyed on the umpires’ tightening of the 15m rule. Brisbane struggled to adapt to Collingwood’s aggressive front-half press and often found themselves caught in-between lengthening the ground and providing overloads on the 45s, making them vulnerable in transition when they turned the ball over. 

    This dichotomy in performances can be attributed to combination of factors; greater scrutiny of the stand rule; greater leniency of the 15m rule; Collingwood’s lack of speed in the front half, missing McCreery and Hill (sub); Brisbane making offensive adjustments to stay more connected to their deepest forwards; and finally, the MCG factor. 

    The last point is somewhat provocative and counterintuitive. How can a team based in Brisbane be better suited to the MCG than the primary occupants in Collingwood. Part of the answer lies in Brisbane’s style. At the beginning of 2024, they doubled down on their kick-mark approach, leading the league with 110 marks per game. They entered the Grand Final of 2023 winning only one of their last 11 games at the home of footy (which was the previous week’s preliminary final against Melbourne). Since the Grand Final loss, they’ve won six out of seven, turning the MCG into somewhat of a mini fortress. 

    The MCG provides Brisbane with the extra width and length to maximise the benefits of their control game. Give them too much space and they’ll pick you apart.  Over-correct and they’ll just play around you.

    Look at the video below, which analyses two plays that highlight the differences between Brisbane’s approach in round 6 at the Gabba and round 21 at the MCG. 

    To further emphasise the point, take a look Brisbane’s kick map across both games. In Round 6, Brisbane often got caught on the flanks, happily taking what Collingwood were willing to give up. Their profile looks like a two-hour session of circle work. 

    In contrast, round 21 looked a lot more like the Brisbane of 2024. Changing angles, attacking the corridor, using the full width and length of the ground, quick release kicks and still undefeated on the MCG.

    Maybe I’m wrong and guilty of being a resultist. Maybe I’m right, and Collingwood delivers another beatdown at the Gabba. Or maybe we’ll have to wait until Grand Final Day to find out.


    Luke Beveridge, enigma of the West

    Jack Turner | The Back Pocket | TheBackPocketAU

    As a player, Luke Beveridge never really planted his flag successfully.

    Beveridge played 118 games across three clubs (Melbourne, Footscray and St Kilda) without reaching the half century at any of them. No real personal accolades aside from making the Greek Team of the Century, almost purely to make up the numbers.

    His rise as a coach followed a less traditional pathway also. He didn’t move from playing into the assistant coaches box or try his hand coaching in the VFL, SANFL or WAFL. Instead, he went back to dig his heels in at grass roots level coaching St Bede’s Mentone in the VAFA. 

    When Beveridge arrived at St Bedes, they were competing in the C Division. His now-trademark style of emotional buy-in, and building a theme around the season took the Mentone Tigers to the Division C premiership in 2006, the Division B premiership in 2007, and ultimately on to the Division A premiership in 2008. If we paid as much attention to our amateur or semi-professional leagues in Australia as they do in some other sports, this would be the stuff of folklore.

    It became obvious to those paying attention that he had a knack for coaching, and was quickly snapped up by Collingwood’s AFL program alongside legendary coach Mick Malthouse, and was a part of the coaching panel that led the Magpies to their droughtbreaking 2010 premiership. St Bedes Meltone have still not won a premiership in any division since 2008.

    Beveridge then took a break in 2011 – a year that an “unbeatable” Collingwood side couldn’t get the job done against Geelong three times – before returning to assistant coaching at the top level, this time under Alastair Clarkson at Hawthorn, helping oversee the first two of the now famous threepeat, before a coaching spot opened up at the Western Bulldogs due to the retirement of Brendan McCartney. 

    When Beveridge took over at the Bulldogs, they were coming off of one of their worst three season runs in the modern era, with many tipping them to win the wooden spoon, due to just seven wins for the season and Adam Cooney and Ryan Griffin departing to Essendon and GWS respectively.

    Instead, the modern Docklands marvel that is Luke Beveridge impressed right from the get go, taking a plucky young Bulldogs side to a sixth-place finish. In just his second season, Luke Beveridge famously won a flag for the Western Bulldogs, something his predecessors had failed to do for 62 years prior.

    Since then the Bulldogs have continued to be thereabouts, but never quite finished the job. Even in 2016 they flew home from 7th to win the flag, and nearly did the same in 2021. One thing he does have over many other coaches who get scrutinised for getting the job mostly done but never completely is that he did win that first flag.

    The intangible that we have to consider when it comes to Luke Beveridge is the strange and nigh unexplainable Docklands effect. No Docklands tenant has made the Top 4 since 2009, and the Bulldogs are the only Docklands tenant to win a premiership since its first year of operation when Essendon had their famous 2000 season run and resulting premiership.

    This weird and near incomprehensible Docklands statistic makes it difficult to judge Luke Beveridge’s tenure when compared to other coaches. Against coaches who have lined up against him on multiple occasions, only five have a positive win-loss ratio, a further five have broken even at 50-50, and twenty-two have lost more than they have won against Beveridge’s Bulldogs.

    Another common criticism of Beveridge is his willingness to throw the magnets around and play players seemingly out of position. A phenomenon that has come to be known in footy circles as “Crazy Bevo”. But for any of the failings of Crazy Bevo’s magnet switches, there are just as many – if not more – success stories.

    Rory Lobb has been a revelation in the backline, Ed Richards was being touted as a Brownlow fancy a mere month ago after being moved from the backline to the midfield. Aaron Naughton and Sam Darcy were both seen as key defenders in their first seasons and yet the two look set to combine for over 100 goals this year.

    Outside of positional switches, there was outcry and mockery at the fact Beveridge didn’t have Daniel or Macrae in his best 22, especially once they were traded and were looking to have an impact at their new clubs early this year. In their stead has come the clear reason why. Freijah has been a clear upgrade on Daniel and Kennedy on Macrae, as the shunned two sat on the bench at their respective new clubs for much of the final terms in Round 20.

    The Western Bulldogs haven’t lost a game by more than ten goals since the 2021 Grand Final. No other team has a streak that extends back further than the start of 2024, with only seven teams – Bulldogs included – having not lost by ten or more goals this season. In fact the Bulldogs haven’t even lost a game by 50+ since their back to back 50 point losses to start off 2023 – a year they still almost stormed home to make finals.

    For all the talk of the miraculous list that the Bulldogs possess, people fail to look past the stars and into the role players. The team that just last week dismantled an in-form GWS side to the tune of 88 points included names like James O’Donnell, Oskar Baker, Lachlan McNeil, Caleb Poulter and Lachlan Bramble. At times this year, they have been joined by Nick Coffield, Ryan Gardner, James Harmes and Harvey Gallagher. This is meant as no disrespect to these players who have done a great job under Bevo’s guidance, but they are by no means walk up starts at any other club in the AFL.

    It is important to factor in many of these things when discussing both Luke Beveridge and the Western Bulldogs. It is easy to get caught up in their ceiling to floor ratio, and the games they have lost in recent years that they should have easily won, but when it is all laid out, Beveridge has one of the better modern coaching records, and remains the Bulldogs only AFL era premiership coach.

    Will Luke Beveridge’s Bulldogs side cause havoc in the finals series this year, and win another unlikely flag? It’s probably less likely than it is likely, but they boast two of the most unstoppable players in the league in Bontempelli and Darcy and nobody loves an underdog story more than Bevo. I don’t think many teams would be excited to face them in a last chance final.


    History doesn’t repeat itself, but it often rhymes

    Emlyn Breese / CreditToDuBois.com

    This is an excerpt from a longer piece published on CreditToDuBois

    Simon Goodwin’s tenure as coach can, more than any other, be defined by a rule. Fitting for the coach of the Demons that this rule would be 6-6-6.

    Round 1 2017 – Simon Goodwin’s first game as Melbourne Coach. The Demons take on Alan Richardson’s St Kilda. All time Saints great Nick Riewoldt kicks two goals in the first quarter continuing his long-running torment of Melbourne. The 6-6-6 rule isn’t even a gleam in Steve Hockings eye and Goodwin has up to 9 players starting in defence at times.

    This isn’t a flooding strategy though – as the ball bounces the spares move through the centre square to provide attacking options. It sees them win 10 consecutive centre clearances and helps turn the match with a run of 10 goals.

    Image: Fox Sports

    Four years later and as far away from a Round 1 twilight game at Docklands as you can get – the 2021 Grand Final in Perth. We turn to the middle of the match. Marcus Bontempelli has put his Bulldogs three goals up and Melbourne are on the ropes. A goal to Bayley Fritsch sees the margin closed and the ball returned to the centre. In less than a minute of game time the Demons rip the ball out of the middle and score a further two. Even more astoundingly, ten minutes later they do the same again, scoring three goals in the final minute of the quarter.

    The 6-6-6 rule means nowhere to hide and few ways for the Dogs to mitigate the damage. The result is the most astounding display of pure football since the peak of Geelong’s time under Mark Thompson, and possibly ever. Melbourne score 100 of the last 107 points of the match and Goodwin breaks the longest active premiership drought in the league.

    We move forward another four years, but like many stories we return to where it started. Docklands. Twilight time-slot. The opponents are once again St Kilda, although faces have changed or moved roles. Alan Richardson now plays confidant to Goodwin rather than competitor. Nick Riewoldt provides commentary as Nasiah Wanganeen-Milera anoints himself as the heir to St Nick in the St Kilda mythos with two last quarter goals.

    Like the Bulldogs four years prior, Melbourne finds their options limited in blunting a withering 9-goal onslaught. However, 6-6-6 still has an even more central role to play. Melbourne goes where few teams before have tread, and none with such dire consequences. They concede a free kick for a 6-6-6 infringement at the final centre bounce with scores tied. This leads to a Wanganeen-Milera mark and a goal after the siren to seal Goodwin’s fate.

    He would go on to coach the following week, and Brad Green denies the result played a part in his sacking, but it’s plain to see this is where Goodwin’s career at Melbourne was decided

    Throughout Goodwin’s coaching tenure his contribution to his game and club have continually and unfairly been diminished. Now is as good a time as any to look at his legacy.

    Taking the team to a preliminary final in 2018 was largely credited to the framework Paul Roos set up. Make no mistake though, this was light years away from anything Roos had coached.

    People finally gave Goodwin ownership of results when Melbourne finished in the bottom two the following year.

    The ultimate success of 2021 was attributed to hyperbolic assessment of Melbourne as one of the greatest playing lists ever assembled. Yet it was seen as Goodwin’s failing when those same players kicked themselves out of consecutive finals in 2023.

    Simon Goodwin took over from one of the more defensively-minded coaches of the modern era. Within two seasons he had forged the team into one of the most potent offences we’ve seen in a decade. He was then able to transform it once again into one of the greatest defensive sides in the game’s history. Most coaches don’t succeed in one style, yet Goodwin appears to be criticised more than anything else for not being able to guide a playing group through a third successful metamorphosis.


    Does a radically smaller ground change how AFLW games are played?

    Sean Lawson 

    A common take on social media is that AFL Women’s games would be better or higher scoring if played on a much smaller field. Presumably this notion is based on a perception that regular fields take too long to traverse for AFLW players’ kicking distances and running speeds.

    For people who believe in shrinking AFLW grounds, the first round of the AFLW presents a very special opportunity to watch some women’s footy under these very conditions.

    When Sydney host Richmond in their Round 1 clash at North Sydney Oval next Friday, viewers get to see the women’s game played on by far the smallest oval ever featured in either the AFLM or AFLW .

    North Sydney is uniquely small, and more distinct from other venues than anything else seen in the AFLM or AFLW. At 125 metres, it is a full 25 metres shorter than any other AFL ground in use in either league, and 35 metres shorter than the average ground.

    At 108 metres, it’s narrower than anything else except North Hobart Oval, though it’s relatively close to the narrowness of Norwood Oval’s width, a venue used in both the AFLW and AFLM.

    In terms of area, using the simple formula for an ellipse, North Sydney Oval at about 10,600m² is about 58% of the area of the largest ground (Cazalys in Cairns), and only about two thirds the area of a standard ground like Docklands. 

    For reference here is a sortable list of all the grounds being used in the AFLW this year and their dimensions:

    The centre squeeze

    So, how does the wildly small field at North Sydney impact footy? Most obviously, the shape of the centre square changes. A typical modern footy field features a 50 metre arc at each end and a 50 metre centre square, which obviously will not all fit here.

    Following the pre-2007 SCG strategy of arcs overlapping the square would look very odd here, and also create issues adjudicating the AFLW’s 5-6-5 centre bounce starting positions. 

    Instead, the solution devised is to squish the square end-to-end.This creates the opportunity for very unusual setups such as that employed by Chloe Molloy here:

    The truncated “square” means a starting forward like Molloy can get to the bounce well before the wings do, and even beat midfielders to the ball.

    Sydney don’t run this sort of approach as a full time measure, but here’s an example from 2023’s comeback win against GWS where Brooke Lochland comes in from the forward zone and gathers a hitout which on a full-sized field probably would have been collected by a midfielder:

    Tactical exploration of the centre rectangle has probably been limited by there only being one game per year at NSO. After round 1, the Swans move over to the vibes capital of the AFLW in Henson Park, while North Sydney Oval groundskeepers start developing a cricket pitch for Sixers WBBL games.

    As such, there’s only a modest benefit to spending very much time getting deep and creative on different centre bounce strategies which only work for the first week of the season.

    However, the very close arcs do remain available for centre bounce tactical switch ups, and are something to watch for from Sydney and Richmond at North Sydney Oval on Friday night.

    Footy’s dead space

    Does the tiny ground impact scoring? There’s only a small sample, but what we can say is is these games have not been especially high scoring so far:

    Teams have scored more at several much larger grounds, including the 2024 Swans v Richmond result game at Coffs Harbour. Coffs appears from footage and Google Maps measurements, to be a bit under 180 metres long, good for the longest venue in either league.

    A primary reason why NSO doesn’t see more scoring is probably that large parts of a footy ground are dead space at any given time. Most footy is played in an effective area quite a bit smaller than even the tiniest AFL fields. Here’s a shot from last season’s game at North Sydney Oval, ahead of a throw-in at the forward pocket:

    All players are bunched into roughly one quarter of even this very small playing surface. 

    Consider how we expect play to unfold here. A throw-in possession can only be kicked a certain distance, and players are positioned to get wherever a kick could go. At that point, there could be a mark or free kick, or a spilled ground ball. In either case, players will already be running to maintain the bubble around that new situation.

    There’s only so far, and so fast, the ball can go, and players work to keep ahead of that action. At all times, the players’ reading of the situation, their structures, and their anticipation, define the active play area, and it’s always an area much smaller than the entire field.

    Fully using the entire field all at once means getting the ball truly to the outside of the active bubble, which eventually results in a released player running into an open goal. It’s difficult to engineer that, and if it happens, the empty grass ahead of the play works the same and plays the same, regardless of dimensions.

    Vertical and horizontal space

    Intuitively, though, one would think that 35 metres less distance goal to goal would result in far more scoring just because less kicks are required to get there.

    Quick-end to-end play does occasionally take place at North Sydney, if things break correctly:

    If a team can chain together long kicks either by winning a few contests or well executed leads, the shortened space is certainly there to exploit, and the game will have moments of very rapid transition from end to end.

    However, just as often, the narrow width and short length of the ground combine to crush the available horizontal space and congest the game. Here’s Collingwood exiting defensive 50 towards the very shallow wings and finding themselves immediately with little room to move:

    This is fairly normal coverage by Sydney on a wide Collingwood ball, but note how in this smaller ground, the Swans players pretty comfortably occupy space all the way to the corridor and a little beyond. Switching play and shifting defences will be relatively difficult with only 109 metres of width.

    The lack of width, and the temptation of that short vertical distance, should often allow teams to hedge more strongly towards defending down the line roost kicks.

    All in all, when it comes to a shrunken AFLW field, there doesn’t seem to be a particular reason to think that knocking 30 metres off the end-to-end distance is enough to make up for the relatively easy width coverage also allowed. That roaming bubble of footy action can move both directions, but when it overlaps with the edges of the ground, it can afford defending teams more capacity to congest ahead of the ball.

    This isn’t to say that a smaller ground can’t have high scores, rather it’s just to say that like any other ground, scoring levels are probably dependent  on tactics and team attributes rather than the amount of raw physical space.


    Around the Grounds

  • Round 21, 2025

    Round 21, 2025

    This Week In Football is a collection of some of the best in football currently outside the walls of AFL clubs or broadcasters. Each week a curated grab bag from regular contributors and special guests will provide insight into and beyond the game on subjects of their choosing. For more about our contributors, click here.

    Banner images by Polly Porridge of the True Bloods Podcast. Check out her other design work.

    Before the Bounce

    Sometimes good moments in footy are good.

    Sometimes they come on the field, but there’s the rare off-field moment that raises a smile.

    Trigger warning for Demons fans.

    The utter insanity of the St Kilda comeback against Melbourne has to be seen to be believed. For all bar the most one-eyed of Melbourne fans it’s an example of footy at its electrifying best.

    That led to one of the better off-field moments of the season too.

    Lyon. Nas. Pub. Shoulders.

    There’s going to be a lot written on the future of St Kilda, Ross Lyon, Nasiah Wanganeen-Milera and physiotherapy treatments for men in their late 50s lifting other men on their shoulders, but sometimes you just need to enjoy the game as it comes.

    This week in football we have:


    Winning the close ones

    Joe Cordy

    After a bumpy start to Craig McRae’s first season at the helm of Collingwood that saw them struggle to a 4-5 record, success quickly followed. The Pies stormed home in the back half of the season, winning 12 of their last 13 home & away games to secure a top four spot with the lowest percentage since North Melbourne in 2007.

    What was truly remarkable about the run wasn’t the stark change in fortune, it was the trend that would come to be the defining factor of McRae’s tenure thus far: his side had a preternatural ability to win close games.

    In what must’ve felt like cruel irony, it all came apart in September. Collingwood lost to both of the eventual grand finalists by single goal margins.

    Season over.

    What seemed at the time like the beginning of a regression to the mean failed to materialise the next season however. Collingwood finished 8-1 in single-digit margin games, all culminating in the lowest combined margin from any premiership side to win three finals. 

    Even as their premiership defence fell apart due to an injury crisis that saw them miss the top 8 the next year, their record in close games held mostly steady (albeit allowing a couple of draws and just barely non-qualifying losses through the gates).

    Following their six-point loss to Gold Coast away and subsequent one-point loss to Fremantle at home, 2025 became the first time that this era of Collingwood have ever had a losing record across a season in games decided by a single kick.

    Some analysts of the game would tell you this was bound to happen eventually. There’s plenty of evidence that on a long enough timeframe, any team’s record in such games will regress towards a 50/50 W-L split, and that the results of such games are “mostly luck.” 

    Football, though, is first and foremost a game of skill. While there’s always variance game to game and moment to moment in how well a given player or team executes those skills, as well as elements completely out of your control, you can control enough to tip the scales in your favour. 

    What McRae and his coaching staff have identified and drilled into the team is the effects of chaos and control in close-game scenarios; namely, how much variance you let into the game

    When Collingwood are chasing a lead late they want to play as open and expansive as possible, even to the point of counterintuitiveness.

    Time is the enemy, and so congestion and stoppages must be avoided at all costs, even if it means letting the ball spill out of a tackle. You’re more likely to win back clean possession in open play than a stoppage, and if you’re going to lose anyway it doesn’t make much difference if it’s by one goal or two.

    Conversely, when Collingwood are aiming to defend such a lead, they want to reduce the variance by restricting the amount of football that can possibly happen.

    Time is the enemy, and so congestion and stoppages are the best way to kill it. Search for the boundary, eschew first possession at stoppages so that you can descend on your opponents when they win it, and either continue to clog up the game or win possession back via free kick.

    The principles of it are simple, but nothing comes easily after being physically and mentally drained by running a dozen kilometres and making thousands of small decisions in a brief 2-3 hour window.

    The importance of keeping your clarity of mind was arguably never clearer than during the last ten seconds of Round 20, when Melbourne had lost sight of their rotations so badly they gave away game-defining 6-6-6 free kick, while St Kilda’s star ruck and midfielder coordinated a set play to create an uncontested marking opportunity inside forward-50.

    However, Collingwood’s edge in this area has started disappearing. Not due to fatigue or absentmindedness, but opponents copying their homework. Some of the earlier adopters have looked pretty inelegant, like Sam Draper diving onto the footy and seeming to dare the umpire to call him out on it. 

    Collingwood’s recent match against Fremantle must’ve felt like looking into a mirror.

    While they tried to open up space and get the ball forward by any means available, they faced a team running McRae’s “kill the game” playbook almost to perfection: pinning the ball at arm’s length to create stoppages without dragging it in, hanging off opponents and conceding first possession in order to wrap them up, handballing along the ground to keep the game congested, even descending on their own grounded teammates to make sure the ball doesn’t go anywhere they don’t want it to. 

    It was a genuine masterclass on both sides of the equation, but more importantly it was the clearest example that the tactical niche McRae has carved out for himself is quickly vanishing.

    Collingwood will still have a massive edge in these situations against disorganised, flustered opponents, but they’re unlikely to ever put up records like 8-1 in these situations again. It’ll probably look like a run of bad luck.


    How about a 186cm Full Forward?

    Cody Atkinson

    Are we ready for Jake Melksham, key position forward?

    Well it doesn’t really matter if we are ready or not – the time is here.

    source: afl.com.a

    But how did we get here – whatever this place is?

    When this TWIF correspondent watched the surprisingly enjoyable Carlton/Melbourne game at the MCG in round 19, something slightly peculiar stood out. No points for the guess here – it’s how Carlton responded to how Melbourne were using Jake Melksham.

    The Demons planted the former Bomber deep in the forward line – often as the closest forward to goal. That’s not particularly unusual across the league. Many sides throw a smaller option deep towards goal to throw the traditional defensive set up off kilter. Charlie Cameron played that role regularly for Brisbane’s most dangerous forward lines, for example.

    Usually this attempt succeeds, and the tall defender usually assigned the deep anchor role is forced up the ground to follow taller timber. In theory it diminishes the ability of the attacking side to take contested grabs inside 50, but it helps generate space and cause disruptions.

    Melksham has also been one of two dangerous forwards for the Demons all year – alongside Pickett. Fritsch has had his moments, but the stocks have been pretty bare this year.

    As alluded to above, Carlton didn’t respond in the usual way. They didn’t stick a small or medium sized defender on Melksham. Instead, they tasked All Australian key position defender Jacob Weitering on him. In isolation this matchup worked for Carlton – Melksham managed just one goal for the game and one mark inside 50, with Weitering hoovering up 6 intercept marks.

    TWIF asked Voss about the match-up after the game.

    “How important is it to have a tall (Weitering) that is mobile enough to go with someone, I guess, you know, half a foot a foot shorter than him? 

    Yeah, he’s a big man. So to get past him is a bit of a challenge. You want to be able to build a defense that can play tall, small – take their turns when they need to. That seems to be what modern defenses are all about. Play a little bit more with where your relevance is to the ball and where your strengths lie…At the same time, we’d like him further up the ground doing what he does best, which is obviously generating and interrupting opposition’s passes of play.”

    For the Demons the tactic is likely bourne out of desperation – a lack of reliable talls to direct traffic through. This make Voss’s response to the situation easier – without multiple credible tall targets deep, it becomes easier to place the most mobile one on the deep anchor – even if that anchor is on the smaller side.

    So how does this all relate to Jake Melksham, 186cm KPP?

    It’s worth noting this is the first year that Melksham is considered to be a tall forward. That’s down not to just how Melbourne have used him, but also how teams like Carlton have responded in kind.

    It turns out that some player classifications are determined not just by position on the ground and particular nominated roles (such as ruck), but also by the players that are determined to match up on them. Champion Data employees callers at the ground to not only determine what happens on the field but also on field matchups. These matchups are relatively rigid and static. The nature of the role perhaps doesn’t reflect how modern footy is played – but that’s a tangent for another day.

    @sportsgrad_

    So, you’re telling me I can get paid to watch footy 🤯  We went behind the scenes with Champion Data to see just how they tell the story of the game and deliver live stats to you in seconds ⚡️  Follow us to learn more of some of the most epic jobs in the sports industry! #jobsinsport #championdata #afl #aussierules #analytics #dataanalytics #fyp

    ♬ original sound – SportsGrad

    It’s these matchups that feed into the player classification model. The type of forward (key or general) is determined not just by where they line up on the ground, but also who lines up alongside them. Because sides like Carlton have sent KPDs to mind Melksham, Champion Data have determined that the small to medium sized forward is actually tall.

    Determining player positions is tough in modern footy. The days of the standard footy field grid are long in the past when looking at how teams actually operate on the park. Interim measures – such as the Champion Data classifications – are increasingly being stretched by inventive coaching and game evolution.

    Further research is being done at both club level and by independent analysts. TWIF’s own James Ives has teased different player classifications, while former legend The Arc developed his own model way back in 2016.

    Or maybe Jake Melksham is just a 186cm KPP? Probably not, but maybe?


    In the margins

    Emlyn Breese / CreditToDuBois.com

    What statistics are correlated with winning and losing in season 2025? And how do those correlations differ for different teams with different strengths and game styles?

    This article comes with an acknowledgement and a few disclaimers. I wouldn’t have been able to do this without the incredible work of Andrew Whelan of WheeloRatings.com – having such a rich data source as a base meant I could take the time to pull together the analysis.

    The disclaimer, for the purposes of this piece, is that I’ve used really simple linear regression with r2 as the basis for determining correlation. It’s not something you’d use to try to put a predictive model together, but it does enough to allow us to draw some interesting points.

    Another disclaimer is that correlation is not causation, and doesn’t establish directionality. For example, West Coast’s margins are more strongly correlated to their ruck output than the rest of the league. Is that because when Bailey Williams and Matt Flynn have managed to win the battle, Harley Reid is able to go to work, or is it that an opposing ruck getting bested by them is emblematic of a team ripe to be beaten by West Coast?

    It could also be that a given stat is a real non-negotiable for a team, it’s something they can be relied to win week in week out regardless of the end result – which would be reflected in a low correlation. The data can hopefully lead us to some interesting points for discussion, but can’t be definitive one way or the other.

    Lastly,it is worth noting that I have used stat differentials (team minus opponent) rather than raw stats when correlating to margin, so keep that in mind.

    With that out of the way, let’s get into the statistical correlations.

    As you’d expect, kicking more goals than your opponent is very strongly tied to the final result. Champion Data’s rating points are also very closely correlated.

    We can see that xScore has a higher correlation with victory than the pure number of shots, which we’d expect from a measure that incorporates not just the volume but the level of difficulty of shots taken.

    Among score sources, Points from Turnover appear more valuable than Points from Stoppage, unsurprising as turnover is the primary scoring source. Points from forward half are a better predictor than points from defensive half.

    xScore rating, that is how well the teams are executing on the shots at goal they generate, appears to be worth about as much as a gap in uncontested possessions, which is a better predictor than contested possessions or clearances.

    Commit more clangers than your opponent and you’re likely to lose, however the correlation is relatively weak (to have a clanger you’ve generally got possession first).

    Defensive half pressure acts is a rare example of a “positive” stat with a negative correlation to margin. If you’re racking them up, it means both that the ball is in your defensive half and the opponent has control of it.

    We’ve got the league averages, so where and how does each team diverge on individual statistics?

    The arrow indicates the direction a team diverges from – a red arrow to the left means that stats correlates less (or more negatively) with margin for the team than for the league at large and blue indicates stronger correlation.

    Adelaide win through having a better spread of goalkickers than their opponents. They’ve had more unique goalscorers on 10 occasions for an eye-watering average margin of +62 points. Handballs are more valuable in their games than average, and kicks less so. The gap in value of points from forward half compared to defensive half expands.

    They also don’t rely on a high mark inside 50 differential as much as the rest of the league. To revisit our disclaimer, this doesn’t necessarily mean they’re bad at it, just that it hasn’t correlated with winning and losing to the same degree it has for other teams. Adelaide has lost 5 games for the year – in three of them they won marks inside 50 and in a fourth they drew. They’ve lost marks inside 50 three times, and won two of those games. They’ve drawn it three times for a three point loss and two 10+ goal wins. They’ve also managed to win by 10+ goals with a +0,+0,+1, and +2 marks inside 50.

    Brisbane aren’t converting xScore into wins particularly well (because they’re 4th worst in goal accuracy this year). They’re getting more value from centre clearances than most teams, and appear to not be as affected by turnovers. This is partly driven by the fact that they haven’t had a turnover differential larger than 8 in the positive or negative whereas a quarter of games league-wide have blown out past this.

    Carlton don’t often lose more defensive 1 on 1s than their opponent, only on four occasions so far and never by more than two. Their biggest wins against West Coast and North saw them win the stat by 6 and 4 respectively. When they’ve been required to make more defensive half pressure acts than their opponent however they’ve got an average margin of -24 compared to +20 the other way. 

    Similar to Adelaide, Collingwood benefit from having a better spread of goalkickers than their opponents. All of Collingwood’s losses have come while winning the inside 50 count and three of the four came while also winning the marks inside 50 count, including a three point loss to Geelong while recording their best differential for the year (+9).

    They’ve only lost the tackle count once all year, in their opening round drubbing by GWS. While they recorded a solid +21 tackles in their 1 point loss to Fremantle, the other two losses saw low differentials (for Collingwood) of 8 and 10. Three of their four biggest wins have matched up with their three biggest tackle differentials. Their pressure game also helps explain why they can lose the kick count convincingly and still come out on top. 

    Essendon want clean hands. Their average result is a 47 point loss when recording more ineffective handballs than their opponent, compared to just a 9 point loss when recording fewer. This is mirrored in effective disposal tallies. It’s not surprising, decimated by injury my best guess is that they just don’t have the drilled structures in place to respond to errors so when things go bad there is little damage mitigation.

    It’s been a common theme of criticism that Fremantle can tend to rack up meaningless uncontested possessions. They’re 7-3 in games they win the count and 6-3 when losing it, but with a slightly better average margin. By comparison their average margin when winning contested possession is +26.2 compared to -10 when losing it.

    Geelong benefit from winning the intercept game as well as tackles inside 50. When the Cats have recorded +8 tackles inside 50 or better they average a 65 point win. On the two occasions they’ve achieved -8 or worse they’ve lost by 18 and 41. They also don’t mind getting on the positive end of some xScore variance. Points from stoppage aren’t as big a predictor for them as others.

    Gold Coast are towards the bottom of the league for post-clearance ground ball, but they’re 8-1 when they’ve won the stat. They boast the same record when winning crumbing possessions, but are dead average in the stat across the season.

    GWS have only won points from centre bounce in 6 games this season, but they’re 6-0 with an average margin of +45 when doing so. They’re not as dependent as most teams on building an xScore advantage to win, because they outperform their opponents on xScore rating by a maddening 10+ points per game.

    I’ll be back next week to step through the remaining nine teams as well as hopefully looking at which teams do or don’t have their performance captured well by Rating Points.


    Comparing this year’s finals race

    Sean Lawson

    The race for finals is down to 9 teams with a month left to play in the regular season of 2025. Sydney’s loss to GWS dropped their already remote finals chances to the purely mathematical realms involving multiple wooden spooner upsets, two collapsing teams, and improbable percentage boosts.

    The remaining equation is pretty simple. One team from the top 9 is going to miss out, and after the Dogs smashed GWS last night, there’s 4 teams (GWS, Hawthorn, Freo and Bulldogs) with a decent chance of missing the cut.

    With 4 weeks of the season to go, this is unusually early for so few teams to be in the hunt for finals in the 18 team era.

    The peculiarity of this season’s ladder is naturally being used to argue for an expansion of the finals to ten sides, so more teams can avoid dead rubbers for longer. However, Greg Swann appears to see the 10-team finals series as a change to be made when there’s 19 teams.

    Most years since 2012 have seen several clubs still in close contention for catching 8th spot. Indeed, some recent seasons have still seen the team as far adrift as 13th a viable chance of qualification, although on average, the top of the bottom 6 has been more than three games behind the pace.

    2016 was the last year where so few teams were in contention for finals a month out. In 2016, there were three games separating North Melbourne in 8th from St Kilda in 9th. Funnily enough, this was the season where North opened by winning 10 of their first 11, and by August were in open free-fall. North failed to win another game after round 20, and the Saints only missed finals on percentage.

    If making up 1 or 2 games on 8th is reasonably possible with a month remaining, most years we can expect up to four teams to still have fans furiously running their ladder predictors and death riding certain opponents.

    This year, all of the calculation of permutations is confined to the top 9 sides. The big reason there’s such a small chasing pack this year is that the fringe finalists are simply losing fewer games.

    This year is the first season since 2018 where the team in 8th has only lost 7 games to this point. Further, with the longer season thanks to Gather Round, the Suns on 12 wins are the winningest 8th place team yet seen in the 18 team era.

    A further consequence of the success of the teams ranked 5 to 8 is that a winning by teams outside the top 4 is that the actual positional spread within the top 8 is quite close at the start of Round 21.

    Those stronger results for the bottom few teams, and the lack of a runaway ladder leader, mean nearly everything is still up for grabs.

    The last few weeks of the season should be a tight jostle for home finals and double chances, everyone in the finals race has winning form to point to, there’s no clear single standout leading team, and it’s honestly strange that so many commentators seem to think that this all constitutes a “dismal” or “boring” season. 


    Around the Grounds

  • Round 20, 2025

    Round 20, 2025

    This Week In Football is a collection of some of the best in football currently outside the walls of AFL clubs or broadcasters. Each week a curated grab bag from regular contributors and special guests will provide insight into and beyond the game on subjects of their choosing. For more about our contributors, click here.

    Banner images by Polly Porridge of the True Bloods Podcast. Check out her other design work.

    Before the Bounce

    A small moment in the aftermath of Carlton’s win over Melbourne last weekend went largely unnoticed except by those who pay attention to post-match press conferences.

    There’s a good reason that most people don’t pay attention to press conferences. This was one of the exceptions.

    At the end of the journalist questions, Michael Voss took a moment to speak about the Carlton Respects program, a community program the football club funds, focused on educating about gender equality as a tool to combat gendered violence.

    It is a serious subject that requires more focus, and more broad attention. Gendered violence is a societal problem that requires real discussions and policy solutions. Football is a just a game, but it is at its best when it mirrors and assists society at large.

    It probably says something about the perfunctory and rote nature of many press conferences that this went by without much further attention.

    This week in football we have:


    A deeper dive into the Threat Index

    James Ives

    Last week, I unveiled the Threat Index, which attempts to identify how threatening teams are across the course of a match. The Threat Index can also guide us on how well teams capitalise on a combination of territory, possession and shots at goal.

    This week, I will detail which teams concede the most goals against the run of play and the games with the biggest margin-threat differentials where a team has lost the game with greater threat.   

    Part 1: Brisbane’s Achilles Heel 

    For years, Brisbane have been dominant in both their transition ball movement and their ability to generate forward half turnovers. If there is one criticism of their game, it’s their inability to capitalise on their field position. In season 2025, almost 40% of opposition goals are scored while Brisbane has greater threat. This is one of the highest returns over the last five years.

    It helps explain why I’ve left a couple of Brisbane games wondering if I read the scoreboard incorrectly.

    Part of this is a result of their aggressive front half press, which explains why we also see other dominant front half teams, such as Collingwood, with high percentages. Interestingly, Melbourne and Carlton both concede similarly high percentages, albeit with much less territory and possession than the likes of Brisbane and Collingwood. 

    Part 2: The Back Breakers 

    That leads into a broader type of game – where a team wins despite the flow of game being against them. Here is a list of games with the biggest differentials between threat and margin.

    Gold Coast’s round 19 horror loss against Adelaide comes out on top.  We can see a critical period early in the game between Adelaide’s 2nd and 3rd goal in the visualisation below.

    In this five-minute stretch, Gold Coast had eight inside 50s to Adelaide’s two, and three shots to Adelaide’s one – which was generated from a kick-in and resulted in a Tex Walker banana from the pocket with an expected score of 2.3. A truly soul-crushing goal against the run of play. 

    Part 3: The Threat Leaders 

    The threat ladder shows Brisbane sitting atop, led by their dominant possession and front half game.

    Carlton and Melbourne sit just inside the top 8, highlighting their inability to convert territory into scores. While GWS sit 13th, highlighting their ability to absorb positional pressure and their counter-attacking prowess. 

    As always, please send through any requests, feedback or questions.


    Where it all begins

    Emlyn Breese / CreditToDuBois.com

    Centre bounces are one of the things that sets Australian football apart. Not so much for the novelty of the bounce, but because after a major score possession is reset to neutral. In most sports play restarts with the ball in possession, whether alternating (e.g. netball) or given to the team who conceded (e.g. basketball, soccer).

    That makes centre bounces an incredibly potent weapon. There aren’t any brakes that the rules applied, only what the opposition can summon. A patch of dominance can reshape the course of a game in mere moments.

    Who’s delivering at centre bounces this year then?

    Getting the clearance isn’t the only way a player can contribute at a centre bounce. First possession is important, rucks can add a lot through hitouts to advantage, and defensive pressure is critical. For the purpose of a single number to measure impact though clearances work pretty well.

    Centre bounce attendance and clearance rate, 2025

    As expected, down the bottom right in the “high attendance, low clearance” group we see the primary rucks. Solo rucks are there 80% or more of the time, but they’re generally not going to be winning clearances themselves at a high rate.

    Above that we’ve got some of the other heavily used midfielders. Caleb Serong stands out among them as the only player attending a high number of clearances to keep a clearance rate (clearances / bounces attended) above 15%.

    The top left is where things probably get the most interesting. We’ve got three players who have attended (relatively) few bounces this year but when they do are making things happen at an alarming rate.

    Going back as far as 2021 (and limiting only to players with 100+ CBAs in a full season (or 75+ so far this year), Nasiah Wanganeen-Milera, Joel Freijah, and Cam Rayner are the only players to have a clearance rate above 20% across a season (Paddy Dow finished with exactly 20% in 2023).

    How these three got to their CBA numbers is quite different though.

    Centre bounce attendance by Freijah, Wanganeen-Milera and Rayner by round, 2025

    Wanganeen-Milera has had four games with 40%+ attendance, including 79% last week, his other 14 games have seen two in the 20s, three below 10%, and the rest with no attendances. It seems clear the Saints are looking to build into him the capacity to be an elite primary midfielder, rather than a half-back who rotates through.

    Freijah on the other hand has seen between 20% and 40% of bounces in 11 of his 18 and attended at least 5% every week. Rayner is somewhat similar, although with a higher floor and lower ceiling, all of his games falling between 7.7% and 25%.

    This brings us to the question of how teams are sharing the load more generally.

    Club centre bounce attendance distributions, 2025

    The chart is ranked in ladder order as of the end of round 19. Teams where the dark colour extends further right represent a higher concentration of CBAs among a smaller number of players – for example 93% of Brisbane’s CBAs have been taken by 6 players – Neale, Dunkley, McCluggage, Ashcroft, and the two rucks in Fort and McInerney. By comparison Essendon and West Coast use 13 and 12 players to fill out the first 93% of CBAs.

    What does it mean to have a settled centre bounce lineup? To be able to distil down into a single number I’ve chosen a measure of what % of centre bounce attendances are filled by the first 8 players across a season. This is arbitrary to an extent, but looking through the data appeared to give a reasonable point of separation between teams. It then allows us to compare it to an output – centre clearance differential.

    Centre bounce attendance differentials vs centre bounce attendance concentration since 2021

    We can see two things. Firstly a higher proportion of CBAs from a core group appears to correlate to a better centre clearance return. This matches intuition, one of the primary drivers of a high concentration of CBAs is health. Having your top tier midfielders available throughout more of the season will naturally yield better results.

    The second is that over the last 5 seasons CBAs have become more concentrated among a smaller group of players. Four of the 9 most concentrated CBAs occur this year – although for very different ladder results with the teams being Brisbane, Adelaide, Melbourne, and North Melbourne. 

    We also see Richmond and Port Adelaide as the most concentrated teams to have averaged a -1 differential or worse further showing that consistency alone isn’t a guarantee of even centre bounce results.


    Big Docker has you fooled

    Sean Lawson

    What’s a “big club”?

    There’s a well understood hierarchy in Victoria with the “Big 4 clubs” at the top being Collingwood, Essendon, Carlton and Richmond. These clubs have the largest fanbases, long histories of success and the most money. At the other end are the Docklands tenants (derogatory) who have small fanbases, lower profiles and more difficult histories. Regional Geelong and nouveau riche Hawthorn somewhere in the middle.

    But what about the rest of the country?

    It is generally also understood that West Coast and Adelaide are very rich and powerful clubs, by virtue of their large market share in the second and third cities of Australian football. After that though, perceptions and characterisations by fans and media tend to get a lot murkier.

    I decided to test public perceptions of the middle cases by asking twitter followers:

    As it turns out, most people see the second teams in Adelaide and Perth as “small” clubs, but quite a few more see the Lions in Brisbane as a bigger club.

    This didn’t surprise me because I think it quantified something I’ve long noticed about the Dockers: most fans think they are effectively a “minnow” club, and this may even include a bit of an inferiority complex within their own fanbase.

    The reasons for this perception aren’t difficult to understand. The Dockers had a tortured early history, while existing in the same city with the bank-breaking death star of a club that is West Coast.

    And of course, the Dockers haven’t won a flag, whereas the Lions have won 4. Premierships create the perception of power and size, even if Essendon exist to remind us that money doesn’t buy football happiness in the modern world.

    To a certain extent this underdog branding is also how the club positions itself – scrappy battler, ignored by other fans and the media, set up to fail from day 1, disrespected and treated poorly, starved of success.

    This perception is, however, all an illusion. By most reasonable metrics, the Dockers are not just middling, but a powerhouse of a clubs.

    Most obviously, Freo are one of two teams from a pretty big city, one not much less than half the size of Australia’s largest city, Melbourne.

    Perth is footy’s second city and quite a lot larger (and richer) than Adelaide. If we assume the club split in both cities is about 60:40, then the smaller share of Perth is larger than majority share of Adelaide.

    On the strength of this background alone, we have to suspect that even the smaller team based out west has to be doing pretty well for itself.

    And that scale of population translates into fans. Fremantle’s crowds have been persistently huge for years now. They used to fill Subiaco pretty well and right now, with the Eagles at a low ebb, they’re even outdrawing the cross-town megaclub.

    Indeed, Freo are outdrawing everyone else except Collingwood right now. That’s when we measure each club’s own fanbase in isolation by excluding games where both teams are based in the same city and both fanbases are contributing to the crowd figures:

    Money-wise, Fremantle is a fairly well-off club, too. The AFL distributes shares of broadcast revenue to all clubs to enable them to fully fund their football programs to clubs. Small needier clubs receive more revenue and larger clubs receive less.

    These distributions serve as a rough (but not exact, given differences in operating costs and the like) guide to how the AFL has measured each club’s financial capacity:

    Fremantle are among the clubs considered to need the least support, as befits a big team in the second city of football.

    Note that on the other hand, the Lions receive a lot of support from the AFL, as they have done since equalisation really took hold around 2015. The Lions are based in a development market and were heavily impacted by the introduction of the Suns, with membership and crowd data indicating that perhaps a quarter or more of the Lions’ attendance base (presumably concentrated in Gold Coast) was lost to the Suns. That impact would have amounted to several million dollars of revenue a season.

    Fremantle’s financial health is of course largely because, with those huge crowds and a large, rich and football-obsessed city at their back, they generate simply a lot of money from football.

    This is my best estimate of the relative “profitability” of each club’s football operations, from an article earlier in the year. It is the money they make from sponsors, memberships, gate, merchandise, after the costs of providing these things are deducted:

    With their lack of silverware, their powerful neighbour, their off-broadway TV timeslots and low profile in Melbourne, Fremantle might not feel like a powerhouse club. But perception isn’t reality. They aren’t West Coast, but the Dockers are massive. Don’t let them or their enemies trick you into thinking otherwise.


    Around the Grounds

  • Round 19 2025

    Round 19 2025

    This Week In Football is a collection of some of the best in football currently outside the walls of AFL clubs or broadcasters. Each week a curated grab bag from regular contributors and special guests will provide insight into and beyond the game on subjects of their choosing. For more about our contributors, click here.

    Banner images by Polly Porridge of the True Bloods Podcast. Check out her other design work.

    Before the Bounce

    Can you really boss football?

    There might never be a definitive answer to that philosophical issue. In the meantime Greg Swann will be tasked with what might be one of the hardest jobs in the code.

    As of Monday, the former Brisbane Lions head honcho steps into AFL House in a newly created “Football Performance Executive” role in the executive suite.

    Similar jobs have created vitriol for those who have sat in the chair. Names like Hocking, Scott and Kane have been spat out in colourful terms by those in the outer whenever any change to the game is made.

    Swann will rapidly become the face of the changes that will inevitably be made to the sport in the coming years. Swann has already flagged the “speed of game” as something that may need to be addressed. Concussions and head knocks also continue to be a major issue, with contact and tackle rules surely being investigated for potential change.

    Whatever decisions the league makes, there will be an element of footy fandom that just wants the game to return to what it was. Keeping those people, the clubs, the media and the rest of the AFL executive happy is a tough tightrope to walk.

    Swann will have a tough job ahead in an increasingly combative football conversation.

    This week in football we have:


    If only there was an easier way to talk about goalkicking accuracy

    Lincoln Tracy – @lincolntracy

    Last week there was an article on the AFL website that praised the goalkicking accuracy of the Greater Western Sydney Giants at their home ground, Engie Stadium (the Sydney Showground), compared to how other teams perform at the venue, as well as the league-wide average:

    “For the past four seasons, the Giants have an accuracy rate of 54 per cent at home, while the opposition convert at just 43 per cent at Engie Stadium. The League average in that time is 49 per cent, meaning the Giants at home are well above AFL average, while their opponents are well below it”

    This piece raised a few eyebrows among some of the contributors to This Week In Football, primarily because it focused solely on goalkicking accuracy (goals vs behinds) and made no mention of the expected score (or xScore, for short). 

    If you’re not familiar with the term, the expected score concept looks at every shot on goal each team has over the course of the game and calculates how many points each shot should have scored based on historical scoring data. The historical data considers a range of factors when determining the xScore, including how far away from goal the player is, the angle of the shot, whether they are taking a set shot or are under pressure.

    Different analysts and organisations have created their own xScore models, including Andrew Whelan (Wheelo Ratings), Adam Tunney (AFL xScore), and ESPN. But ultimately all of the models indicate whether individual players or teams have scored more or less points than what they should have. It’s a more sophisticated way of looking at scoring among AFL teams compared to simply looking at goalkicking accuracy.

    And we don’t have to look too far back in order to find a game that highlights some of the differences between goalkicking accuracy instead of something slightly more sophisticated: the clash between Hawthorn and Fremantle in Round 18, where Fremantle won by 15 points. The Dockers were more accurate from a goalkicking perspective (12 goals, five behinds from 17 shots at goal; 60%) compared to the Hawks (nine goals, eight behinds from the same number of shots, 40.9%).

    However, Fremantle under-performed from an xScore perspective while Hawthorn essentially scored as expected – primarily because of the very small number of shots from high-value positions. Andrew Whelan’s shot map (below) highlights this quite nicely. 

    Credit: Andrew Whelan

    So now that we have a better idea of what xScore is and how it is more nuanced that goalkicking accuracy alone, let’s look to see how the Giants (and their opponents) perform at Engie Stadium with respect to xScore using Adam’s AFL xScore data over the same timeframe as the original article (2022 to 2025).

    Over the past four seasons Greater Western Sydney have exceeded their expected score by an average of at least 4.9 points while playing at the Showgrounds, and have exceeded their expected score in over half of the games they have played. This is well above what is seen for their opponents and the league more broadly with respect to both the average difference between the expected and actual scores, and the proportion of games where the actual score exceeds the expected score.

    Examining the xScore data also shows that the Giants’ performances at the Showgrounds in 2025 is somewhat of an outlier compared to other years, unlike what is seen when we only consider goalkicking accuracy. GWS have kicked goals from more than half of their shots in four of their six games at the venue so far this year and exceeded their expected score in all but one of the games.

    The two matches with sub-50% goalkicking accuracy were the Opening Round clash with Collingwood and their Round 10 encounter with Fremantle, while the Fremantle game is they lone match where they did not exceed the expected score. Astute observers will notice that the Dockers clash is the one game the Giants have lost at the Showgrounds this season.

    It’s a much different picture at Manuka – the Giant’s home away from home, however. GWS perform significantly below average on each of the metrics, and their opponents seem to have good years and bad years when playing in the nation’s capital. It therefore comes as little surprise to see that the Giants have a much better record at the Showgrounds (19-10) compared to Manuka (4-12) over this period of time. Fans of the orange team will take some comfort in the fixture, with the Giants slated to play two more games at their home base in Sydney and only one more in Canberra. 

    Other teams who have significantly outperformed their opponents on xScore are Sydney at the SCG (average difference in proportion of games above xScore of 23%, even with there being no difference to this point in 2025), Hawthorn at York Park (+21%), and Adelaide at the Adelaide Oval (+20%). At the other end of the spectrum, Melbourne at the MCG (-17%), Brisbane at the Gabba (-19%), and Richmond at Docklands (-38%) tend to score below their xScore more frequently compared to their opponents.


    Building a Threat Index

    James Ives

    Is there a more frustrating sequence as an AFL fan than when your team concedes a goal against the run of play?

    Every fan has experienced it before. A sustained period of territory and possession dominance, only for the opposition to slingshot down the other end and score a goal – killing off all ‘momentum’ with one big giant sucker punch.

    It was noticeable in the Richmond vs Carlton clash in round one, where Carlton dominated all night peppering Richmond with a barrage of inside 50s only to find themselves down by 11 of the final siren; or Gold Coast’s back-to-back goals following Collingwood’s 40-point comeback in round 18; or Brisbane’s inability to capitalise in the last 10 minutes of their round 13 clash against Adelaide. Currently, we can tell the story through a combination of territory, possession, inside 50s, expected scores. But there isn’t an all-encompassing metric that measures threat. That’s what I’ve attempted to do in this piece. 

    What is it? 

    Threat is derived from my previous expected threat model with elements of equity ratings. It aggregates the maximum probability of scoring a goal from each chain across a rolling (approximate) 5 minute window to determine which team had the more threatening chains. 

    How is it calculated? 

    The goal scoring probability is calculated using field position and possession states – set and general play – for every possession in a chain. It then derives the maximum goal scoring probability for the team that owns the chain. 

    Examples

    Takeaways:

    • Carlton was more threatening for large parts of the game
    • Richmond managed to score 7 goals in periods where Carlton was more threatening compared to Carlton’s 1 (which now allows us to understand how many goals teams score/concede against the run of play)

    Takeaways

    • This game was a lot more even with both teams scoring goals against the run of play
    • 3 of Adelaide’s last 5 goals came during periods when Brisbane had greater threat
    • The most dominant period of play came in the last 20 chains when Brisbane failed to capitalise 

    Next steps

    This is still somewhat of a work in progress and requires some further tweaking. Any feedback is welcome. 

    Next week I’ll detail which teams lead the league in scoring and conceding against the run of play. 

    P.S Please @ me if you’d like me to run the viz for any specific games from the season so far.


    Shark Week

    Emlyn Breese / CreditToDuBois.com

    There’s a lot still to chew through in the data behind last week’s ruck piece.

    Given that Shark Week starts this Sunday this topic seems only fitting.

    For those unaware, Champion Data gives a definition of a sharked hitout as “A hitout that directly results in an opponent’s possession.”

    [author’s note: I’ve had to infer sharks from the data I’ve got which probably results in some false positives. I’d expect my numbers to be a little higher volume and lower quality, but should still be broadly representative]

    So, who is Jaws to the AFL’s Amity Island?

    Jack Macrae has a clear lead feasting off opposing rucks, and the list overall isn’t too surprising – elite inside midfielders who are great at winning their own ball.

    On the other side of the ledger it’s Matt Flynn who’s chumming the water most regularly this year.

    If we expand it out to a team-wide scale we can find Adelaide has the worst differential in the league between sharking and being bait, which isn’t totally surprising as Reilly O’Brien gets sharked regularly.

    St Kilda being on top is somewhat surprising, while the Bulldogs at #2 are to be expected with the mids available to them.

    I’ve got data going back to 2017, so let’s see if there are any particular feeding frenzies. On top we’ve got Brisbane feasting on Adelaide to the tune of 26 sharks in their round 9 matchup last year.

    Finally, over that expanded timespan who of our sharks has a taste for a particular player?

    Have we built the AFL where the footy people are?

    Sean Lawson

    Despite the dramas around the Tasmanian team, another round of expansion talk was kicked off by media reports suggesting that the WAFC is starting to take the question of a third team in Western Australia seriously.

    TWIF’s own Joe Cordy also posed a question related to the expansion question, asking what a new AFL created with no history might look like:

    Logically, the best way to figure out where teams should be based would be to go where footy fans are. Fans are a nebulous thing to define The polling company Roy Morgan rather notoriously likes to publish survey data from a market research perspective showing Sydney and Brisbane with the largest fandoms in the league.

    But Roy Morgan wants to sell fan profiles to advertisers, and therefore privileges name recognition and extremely casual interest. A large majority of their profiled “fans” don’t attend games and a solid percentage don’t even watch on TV.

    We need a firmer basis for identifying where the football fans are than that, and luckily the Australian Sports Commission runs a large survey called Ausplay that collects information about sport participation. Playing footy is a pretty reasonable proxy for where the “footy people” are.

    Fairly obviously there is a preponderance of Victorians playing footy, about 40% of the national total, as well as a surprisingly tight spread across the other four mainland states. These numbers mean Victoria punches above its weight in national talent contributions, as over half the player pool are from Victoria.

    Correspondingly, NSW and Qld produce far fewer AFLM players than their footy player base would suggest, which is down to many historical and cultural factors.

    There is also a pronounced gender split in footy demographics by state, especially for adult women’s participation:

    Simply put, it appears that North of the Barassi line, footy is more of a women’s game while women’s participation lags in parts of the heartland.

    Converting the national participation shares to the ideal distribution of an 18 team league we get the following breakdown of teams in a fresh start:

    This is not too different from today’s setup. Victoria is over represented in the AFL, unsurprisingly, but still would warrant 7 teams in an evenly distributed competition.

    With 7 Victorian teams in our “fresh start” league, compared to the contemporary AFL the three “extra” teams would be allocated to Western Australia, New South Wales (more on that in a moment) and Tasmania.

    It should be said, against various arguments to rationalise the Victorian clubs, that the difference between 7 and 10 Victorian teams is probably not that substantial from a football finance perspective. Those three extra teams located near the big teams would be generating a lot of economies of scale, saving travel costs, and boosting overall attendance by bringing a lot of extra people through the gates as away fans at the many Victorian derbies which occur.

    But let’s get back to the question of expansion, and in particular, that suggested under-representation of NSW. This number looks odd on the face of it – New South Wales with the third most footballers of any state? And potentially warranting a third team, like footy powerhouse Western Australia?

    Barassi Line illustration, source ABC News

    As any student of footy should know, though, the unique thing about NSW in Australian football is that a lot of its football base is in the south and east of the state, rather than in Sydney. South of the Barassi Line, things get AFL focused.

    We can more or less quantify how much this matters to NSW footy numbers.

    Ausplay prior to 2023 had local government area participation estimates for Albury, Wagga Wagga and Bega which all placed Australian football participation at over 6%. Most other LGAs in NSW were too small to have data, or situated further north without footy participation breaking into the top 10 activities.

    If we extrapolate those Albury and Wagga participation rates out against the population of the southern NSW Riverina and Murray regions as a whole, we get probably about 16000 footballers in that region, more than in NT and not too far below the number in Tasmania.

    But then of course, there’s also a notable city of a half a million people sitting surrounded by southern NSW, with another roughly 12000 footballers.

    Surrounding Canberra is a region which, while not footy heartland, can be estimated using ACT participation rates to maybe have about 6000 footballers as well.

    Putting all that together, we can see that there’s a largely forgotten football region, with more footy people than the current new expansion location of Tasmania. It is a region centred between Albury, Wagga and Canberra, though also stretching a long way west.

    Adjusting our quotas to split NSW and combine the southern regions with the ACT, we can see that our third NSW quota reassigns fairly comfortably towards the Barassi Line:


    Around the Grounds

  • Round 18 2025

    Round 18 2025

    This Week In Football is a collection of some of the best in football currently outside the walls of AFL clubs or broadcasters. Each week a curated grab bag from regular contributors and special guests will provide insight into and beyond the game on subjects of their choosing. For more about our contributors, click here.

    Banner images by Polly Porridge of the True Bloods Podcast. Check out her other design work.

    Before the bounce

    This season, for all its apparent evenness, has ended up strangely bifurcated between the two halvs of the ladder. Three wins and percentage separate 9th and 10th, and while there’s about a 1 in 20 chance of 10th bridging that gap with a mad win streak and two other teams collapsing, for all practical purposes the race is now down to half a dozen teams trying not to be the one team that misses out when the season is done.

    This has triggered a lot of talk of the season being too long, and a lot of opportunistic discussion of ideas to make the long winter stretch more interesting, but it’s worth remembering that:

    1. The race for 9 teams into 8 spots is still pretty fun and exciting
    2. One of the reasons the ladder is the way it is is the parity between most of the top 8, and as a result the premiership race looks very open
    3. The other main reason for the gap is the teams sitting 10th to about 14th have won less games than they usually do.

    With fewer expectations on Essendon and St Kilda this season, we can probably name the Swans, Port, Carlton and Demons as the four sides who are, for different reasons, further adrift than most would’ve expected early in the year. That’s a whole chasing pack who, most other years, would be jostling for finals right up until the last couple of rounds.

    It’s a weird season, but at least the flag race looks pretty open.

    This week in football we have:


    That’s ruck craft, big boy

    Emlyn Breese / CreditToDuBois.com

    I’ve always liked rucks.

    I’m a firm believer that one of the best things a team can do for its marketability is having a really tall guy who stands out in looks and play. My kids are currently Max Gawn supporters first and Melbourne supporters second. 

    As a Melbourne supporter approaching 40 I feel like I’ve seen my fair share of good rucks and then some. Of the 34 All Australian teams named since 1991, Melbourne has provided the first choice ruck eight times, plus another 3 inclusions on the interchange bench (Gawn 5+2, Jamar 0+1, White 1, Stynes 2).

    While we’ve had stats on hit outs and hit outs to advantage for a while, there’s a lack of understanding of how much these impact the game. Let’s look at the potential outcomes of a ruck contest and see where the most value for a team is.

    As you’d expect, getting a free from the ruck contest is by far the best outcome, followed by hit outs to advantage. Ruck hard ball gets also put you in a good position.

    If we look at hitouts overall though, even when including hit outs to advantage as part of that, they barely move the needle. A quarter of them don’t lead to a clearance at all, and teams are almost as likely to concede a clearance or scoring opportunity after winning a hitout as they are to generate one.

    Another consideration is that two Ruck Hard Ball Gets aren’t necessarily the same. Let’s break down some of these outcomes by the top 20 rucks (by hitouts recorded in 2025).

    (Selecting one of the flows will highlight that flow across all charts, allowing for easier comparison)

    In terms of getting the ball moving, Oscar McInerney and Brodie Grundy are kings – 85% and 80% of their RHBGs resulting in a clearance for their team. For the next step along, Luke Jackson generates a scoring chance from 44% of RHBGs, well ahead of the next best in Gawn and English, both sitting at 30%.

    43% of Kieran Briggs’ RHBGs end up with a clearance going the wrong way, while Sean Darcy is a rock – 25% of his result in the ball not clearing the stoppage area.

    Turning to Hitouts To Advantage, Jarrod Witts leads the league in seeing HTA turn to clearances with 83% ahead of Darcy Fort and Matt Flynn on 80%. 30% of Jordon Sweet’s HTAs result in a scoring chance, but he also has the highest number of HTAs turn into an opponent scoring chance at 9.2%. This highlights that these figures can be heavily influenced by the supporting midfielders. Port are electric when they’re on, but can lack some defensive accountability with the league’s worst opposition score from stoppages.

    Now that we know what they’re worth, let’s look at how good teams are at generating them. There are some limitations on the data I have – one being that I don’t know who the opposing two rucks are – only the ones that record a stat (Ruck hard ball get, hit out, getting or conceding a ruck free). Because of that we have to look at these stats team-wide rather than individually.

     Melbourne, North Melbourne, Sydney, and Carlton are the best at generating positive outcomes – each getting a Ruck Hard Ball Get or better from at least 18.4% of their ruck contests compared to an AFL average of 15.4%.

    Looking at the other end, West Coast, Essendon, St Kilda, and the Giants all give up good starting position relatively regularly. Looking at the differentials (% of contests gaining Ruck Hard Ball Get or better minus % of contests conceding the same), Melbourne and North Melbourne are clearly in front at +6%.

    Now, ruck frees aren’t that common, occurring about one in every 36 contests. However, they are impactful – as we discovered earlier 20% of them lead to a scoring chance – so they do warrant a further look.

    Since 2021 the best players at generating more ruck frees than they give away are Ben McEvoy and Sam Hayes. In the opposite direction, Stefan Martin is the only player to break the -1 free per hundred contests barrier.

    For a bit of fun let’s wind up with the head to head ruck free kick counts for the 15 rucks with the most hitouts since 2025.

    The thing that jumps out to me here is just how hard Jarrod Witts is to ruck against. A lot of ruck frees seem to come when an experienced ruckman is up against a pinch hitter. Witts is posting big numbers against the elite rucks of the competition with only Darcy Cameron (5-1) and Oscar McInerney (2-1) getting the better of him.Finally, numbers can only tell us so much. I highly recommend Jeff White’s youtube channel (https://www.youtube.com/@First_Use/videos). It contains a lot of video analysis, but with a particular focus on ruck contests and stoppage play.


    The mostly-one sided nature of common matchups

    Lincoln Tracy | @lincolntracy

    Many of you will know that Carlton and Collingwood have played against each other more than any other combination of teams in V/AFL history, with last Friday’s match being the 268th time the two teams have met.

    Many of you may also know that this has historically been a very even rivalry, with the head-to-head ledger currently sitting at 135 wins for the Magpies, 129 wins for the Blues, and four draws.

    But how even has the rivalry been over its 120-plus year history?  Let’s graph the head-to-head record over time and find out. A quick look at the figure below tells us that there have been a few different periods of dominance by either club.

    Collingwood had Carlton’s number more often than not for the best part of the first century of the rivalry, then it was Carlton’s turn to be on top from the mid 1970’s through to the early 2000s. From that point on the pendulum has swung back Collingwood’s way – and may continue to for some time given how disappointing Carlton have been since the turn of the century. But for the most part, the Carlton-Collingwood rivalry has had some degree of evenness, with neither club being more than 15 wins ahead of the other.

    The second most common matchup in V/AFL history – Carlton versus Essendon – is slightly more one sided. Carlton also started this rivalry poorly, winning just seven of their first 25 games against the Bombers between 1897 and 1906. However, things have been in Carlton’s favour more often than not from that point onwards. The Blues won 19 of the 20 clashes between 1927 and 1939 and 17 out of 20 between 1968 and 1977, with the latter period of dominance resulting in a +21 count on the head-to-head record. However, Essendon have pulled things back since then to sit 10 wins behind the men from Princes Park on the all-time tally.

    Collingwood versus Essendon, the third most common matchup, is even more one sided than the previous two. The Magpies currently have won 30 more games between these two teams than Essendon, and have not been behind in the head-to-head count since 1897. Diehard Pies fans will remember the 1990 team breaking a three-game losing streak against the Bombers in the 1990 semi-final, and getting the better of Essendon again just two weeks later in the Grand Final, the most-recent post-season encounter between the two sides.

    In more good news for the black and white army, Collingwood also has the upper hand on their rivalry with Melbourne, leading the head-to-head by 72 games (157-85, with five draws). The Demons won the first and fourth games between the two clubs, but from that point on it has been advantage Collingwood. Although, to give Melbourne some credit, there have been two seven-game winning streaks against Collingwood since then, from 1939-1941 and from 1955-1957. This latter streak involved the Demons beating the Pies in two grand finals – 1955 and 1957.

    And it’s a similar story for the fifth most common matchup – Collingwood and Geelong. Collingwood struggled early against Geelong, winning four of the first 13 games. A win over Geelong in the 1901 finals series set the Magpies on a 14-game win streak against their feline foes, which tilted the ledger in Collingwood’s favour. But I imagine Collingwood’s good record against Geelong will be of little comfort should the two teams meet again in September, with the Cats winning six of the last eight against the Magpies – including the last two finals (2020 semi-final and 2022 qualifying final).


    Please stop calling things you don’t like “American”

    Sean Lawson

    Look, I get it. Nobody much likes the US these days.

    Everyone’s favourite hegemonic state and nascent autocracy is sliding into a dark place, and we just had an election decided largely by voters rejecting its political and social trends.

    So the temptation to dismiss something we don’t like as being American is substantial.

    But this rhetorical flourish can go too far. In a sporting discourse landscape as replete as ours is with thought bubbles and reform plans, it seems like every week there’s some new innovation being put forth by some talking head. And there’s a common refrain dismissing these ideas as being “American”, a denigration intended to fully invalidate an idea on those grounds alone.

    The behaviour is common on social media but also gets a guernsey in some more professional punditry. For example:

    • Rohan Connolly on the “wildcard”: “Not that history means much to the sorts of vested interests who continually try to cram this Americanised garbage (designed for competitions with conferences, not one ladder) down our throats.”

    Less temperate voices can also be found across social media, dismissing pretty much any idea around as smacking of yankeedom. From shorter game time to removing the father/son rule to private ownership, everything we don’t like is American to someone.

    It’s not all America

    I am not here to argue that American things are not bad. They very often are!

    But I do think that, ironically, many of these criticisms are guilty of giving the US too much credit and centrality on the world stage, assigning certain ideas as exclusively American, when they have a broader currency around world sport or even within Australia.

    Most obviously, the idea of an in-season cup competition, it scarcely needs be said, is most associated with the decidedly un-American sport of soccer.

    Indeed, the NBA in-season tournament was a recent innovation created pretty much with the same reasoning the AFL is following – that if we can replicate soccer’s ability to run two competitions in parallel, we get more watchable content and more happy fans, and more money making opportunities.

    America ain’t free

    Then there’s player free agency. That’s is a particularly funny one to describe as “American” because United States professional sport probably has, on average, the least free player movement of any prominent country’s sporting landscape. Heavy with drafts and player trading, none of the four big leagues have the sort of total and full free agency common especially to soccer in many countries. American “free agency” refers instead to an unusually proscribed and specific set of circumstances.

    Even in Australia, most of our major sports are characterised by pretty much total free agency, the full expression of a player’s unfettered right to work for who they wish.

    In Australian sport, the most common practice is that, give or take some domestic player quotas or a salary cap, players in most leagues can pretty much sign with whoever they want whenever they are out of contract. That applies to the NRL, to the A-Leagues, to both rugby codes, to cricket, to netball, to basketball.

    Indeed, the more AFL free agency expands, the more like other Australian sport it will become. At the moment, the strong influence of the national draft ironically does make it a more Americanised league than many others in this country. I’ve seen NRL fans dismiss the idea of a player draft on the grounds of it being a hated American innovation.

    Wildcards

    Finally, there’s the “wildcard” finals idea. As proposed, admittedly the American links are being created by overt misuse of the term by proponents.

    In an AFL finals context the “wildcard” is simply describing adding a 9th and 10th team and a 5th week to finals, with 7 to 10 on the ladder spending the first week playing for survival.

    That’s pretty much exactly the way the traditional McIntyre top 6 starts for teams who finish 3 through 6.

    The concept of a staggered and asymmetrical finals series with lower teams having to play more weeks and win more games is definitely not an American innovation. Instead, it’s a long-standing Australian one. Our finals systems from the top 4 to the top 8 have all been replete with double chances and bye privileges for higher ranked teams. By contrast, American playoffs often plump for a straight knockout bracket where finishing with the first seed is barely an advantage.

    Even the idea of finals involving many teams have their precedents. As noted last week, in 1898 the finals series used in the VFL involved all eight participating teams, resulting in the scenario in 1900 where Melbourne won the premiership from 6th. A number of footy leagues around the country have long run finals systems featuring over half the sides. The SANFL went decades qualifying 5 of 9 teams, the AFL in 1994 had 8 of 15.

    To be clear, many ideas for new innovations are bad. The in-season tournament proposal, two-part seasons (so called “17-5” or similar breakdowns) where the last few rounds are re-seeded and bottom sides play for a draft pick, permanent conferences to even the ladder out. These things sound terrible! But they’re not terrible because they’re American, and they’re often not even really especially American.

    Meanwhile there significant aspects of our sport which are exactly aligned with practice in the US, things which most fans approve of. These include the draft and salary cap, and a closed league without promotion and relegation. Nobody is advocating to ditch them these features for this reason.

    In the end, the “American” label as a dismissal of novelty is cheap and easy, but it’s often hypocritical, it’s not persuasive and usually not even particularly accurate.


    The long and short of it

    Cody Atkinson, freeloader

    Around this time of the year attention starts to turn to the ancillary awards of the elite competition. No – we aren’t talking about the upcoming AFL In-Season Non-Premiership Cup.

    Instead, TWIF is talking about All-Australians, MVPs, Brownlows, Coaches’ Awards, BnFs…and the big two of them all.

    That’s right – Mark of the Year and Goal of the Year.

    hover over each blue and yellow bar to see each Mark of the Year

    While the former usually delivers an absolute banger of a grab, the latter often leaves a lot to be desired. There’s a lot of this type of goal in the mix.

    That’s no slight to Matt White – it’s a great run, and a good goal. But does it stick out? Colour us doubtful.

    But what if we went another way to work out the Goal of the Year? This week TWIF has decided to look at the extremes – and the extremely average – to see if it would uncover a more spectacular goal that the normal goal of the year.

    The season’s not over yet, but these are some out of the box contenders. None have been named as Goal of the Week this year.

    Longest Goal of the Year

    Everyone loves a roost right? You’re not going to find many better than this ping from Dan McStay last week to put the game well beyond doubt against Carlton.

    Maybe it should have been rushed through for a behind. But who cares – he’s kicked it nearly 67 metres through the big sticks. There’s a couple of others that are close but this is the best of the long bunch.

    Most average Goal of the Year

    So far this year the average distance for a goal is about 31.6m. So surely picking the most average distance for a goal would produce the most average goal?

    Or maybe not.

    Shaun Mannagh’s sealer against Hawthorn put a cap on what was a pretty good game between two likely finalists. It’s far from the average goal, with limited time to operate and frenetic movement opening up the opportunity.

    It should be noted that there are four other goals from the most average distance, but this was the first one chosen at random. Apologies to Nick Daicos, Tim Membrey, Rhyan Mansell and Jack Higgins for their equally average efforts.

    Shortest Goal of the Year

    You might question how you can find the truly shortest goal, and TWIF might agree with you to a large degree. But according to AFL data, this is the shortest one to the centre of goal this year.

    After a look at the footage, it’s hard to disagree.

    This was Jasper Alger’s first AFL goal. Every goal he kicks from here will likely be both less difficult and kicked from further away.

    He barely gets a foot on the ball. The kick goes maybe three metres. Just 10cm or so of that journey is in the field of play.

    It is glorious.

    So maybe we should look at the extremes when looking for the best goal of the year.


    Around the Grounds

  • Round 17 2025

    Round 17 2025

    This Week In Football is a collection of some of the best in football currently outside the walls of AFL clubs or broadcasters. Each week a curated grab bag from regular contributors and special guests will provide insight into and beyond the game on subjects of their choosing. For more about our contributors, click here.

    Banner images by Polly Porridge of the True Bloods Podcast. Check out her other design work.

    Before the bounce

    As we reach the home straight of the season, the likely finals field has narrowed down to just nine teams (James has more on this later).

    As the potential September sides have shrunk, talk has turned (as it always does) to how to get more sides involved.

    Finals expansion has long been discussed at different points of the V/AFL’s history, but recent years have seen a push for a “wildcard weekend”.

    While this push for finals expansion seemingly comes from an American basis, finals expansion likely has its origins in Australia instead.

    Punch, 27 September 1900

    In 1898 the VFL expanded their finals to eight teams… comprising of the whole competition. The use of the system culminated in 1900, when Melbourne, who finished 6th through the home and away season, were able to storm the finals and finish on top.

    The Australasian stated:

    The fact that the system of determining the premiership is not the best that could be framed detracts little from the credit of their performance. They have fulfilled the requirements of the scheme, and they are honestly entitled to the honours they have gained.

    The system was not only used in Victoria, but also around other football playing strongholds such as South Australia. Unfortunately, the system was so successful that it was shelved since then.

    Maybe the solution is not a modest American expansion, but a full-on Australian one. Noted football #influencer Eddie McGuire made a similar proposal a few years back. If there’s one thing Eddie is known for, it’s being measured in his public statements.

    Maybe we all aren’t being bold enough.

    This week in football we have:


    What Makes a Key Forward?

    Joe Cordy

    Jack Riewoldt copped no small amount of mockery recently for saying about Gold Coast spearhead Ben King:

    “I’m starting to come to the belief that I don’t think [he] can be a big finals player. He doesn’t get the ball enough…He is not a key forward, he’s a tall half-forward flanker… If I’m Damien Hardwick, I’d put a call in to Tom Lynch.”

    I don’t know that I agree Ben King can’t play well in finals, or what possessed him to suggest a soon to be 33-year-old Tom Lynch is good for what ails his former coach, but there was something intriguing to me in what he said.

    It’s plainly obvious to me that Ben King doesn’t get enough of the footy to seriously affect games as much as he could, especially compared to others with the key forward label.

    With an average disposal location 51m forward of the centre circle, and an average mark location 57m forward, Ben King is the deepest sitting player in the league in 2025.

    Keeping himself as close to the goals as he does is oft reflected in his output. As well as sitting equal third in the Coleman Medal race, among key forwards this year with at least 10 games under their belt, he’s the only player averaging at least four shots at goal a game with an average expected score per shot above four points. 

    This trend of sitting deep can be seen in his Suns compatriots too, with Jed Walter and Ethan Read pushing the 4.0 xScore threshold for their shots. This is despite King taking the lion’s share of the Suns’ scoring attempts. The issue, which Riewoldt identified, is how little King creates for anyone else. 

    Compared to the other high volume shot takers, King stands out for his total single-mindedness in kicking, averaging just one kick every other game not directly aimed at the big sticks. 

    The same trend can be observed in where he marks the ball. While he’s a constant and ever-reliable target for the Suns at the end of their attacking moves, if you see Ben King mark the footy beyond the arc you should appreciate the sight, as it’s unlikely to come about again another three whole games. 

    In fact, his total marks per game is less than what Charlie Curnow manages just outside the 50m arc.

    All of this stands in stark contrast to how Damien Hardwick’s key forwards in the Tigers dynastic run would operate, which makes it stand out all the more. Riewoldt, and particularly ex-Suns captain Tom Lynch, would frequently push up the ground to link up play, creating inverted structures with Dustin Martin often sitting deepest forward and using his supreme athleticism and goal sense to finish attacks. 

    Arguably the key forward group that most resembles this style of play are with the Tigers’ biggest rivals from that era. Led by Coleman Medal and All-Australian Centre Half Forward frontrunner Jeremy Cameron, Geelong have a trio of talls who not only create ball movement further up the chain than anyone at the Suns, but have retention and threat creation numbers that are pushing for the highest in the league.

    While I’m still not sure that Jack Riewoldt and I have an aligned vision of a tall half-forward flanker, I think we’d agree that this is closer to what we’d like to see from a key forward. Less of a big man waiting for it to be lobbed on top of his head, and more of a Thierry Henry-esque dual-threat in finishing and creation.

    I think Ben King has the tools to add this creative output to his game, but at the moment the Suns setup keeps him restrained fairly strictly to always being within a kick of the goals. Whether this is a reflection of the Hardwick’s estimation of King’s abilities, his changing tactical sensibility, or just how he feels the Suns are best structured given their other pieces is hard to tell at first glance, but it seems clear they’re not currently getting the most out of the former #6 draft pick.


    A few insights from the season so far

    James Ives

    Given the clear separation between the top and the bottom teams, I thought it’d be interesting to have a look at the ladder based on games against the top 9. 

    • Collingwood consistently come up on top, no matter what metric you look at.
    • Fremantle are a surprise in 2nd place, with key wins against the Western Bulldogs, Adelaide, GWS and Gold Coast.
    • The Western Bulldogs find themselves at the bottom of the list, with relatively close finishes against Collingwood, Brisbane, Gold Coast and Geelong. 
    • Port Adelaide’s percentage is a concern for those who believe they have turned the corner after recent wins against Carlton, Melbourne and GWS. 

    These matchups will go a long way in shaping the final 8. Look no further than round 18, where we have a stacked round of season-defining games. 

    Round 18:

    • Gold Coast vs Collingwood 
    • Western Bulldogs vs Adelaide
    • GWS vs Geelong
    • Fremantle vs Hawthorn

    Buckle up. 

    Darcy Fogarty leading the expected score ladder – one of the best set shots in the game. 

    Max Gawn is almost a flawless player. Outside of shots inside 50…


    Do the Bombers Bomb?

    Cody Atkinson, idiot

    Nominative determinism is a fun thing. You know, a baker with the last name Baker, a gold medal winning sprinter named Bolt or a banker named White Collar Fraud.

    We kid (please don’t sue us).

    That raises the obvious questions as posed by the headline. Do the Bombers (of Essendon) bomb?

    We aren’t talking about actual bombing. As is very well known, bombing on the footy field was banned in the 1960s during the ANFC era.

    Instead, we are talking about taking pings from deep – you know, long bombs at goal.

    So…do the Bombers bomb?

    No.

    They do not bomb. In fact, they bomb less than almost any other team in the league. They are particularly reticent from set shots, where they have taken the second fewest shots from outside 50 this year.

    Taking shots from deep serves multiple goals. Firstly – and most obviously – it puts points on the scoreboard. TWIF was recently told that scoring more points than your opponent means that you win games.

    That’s a good thing!

    There’s also a metagame at play. Taking shots from deep helps to stretch the defence and make it harder to defend when going inside 50. If there are credible targets across a wide variety of spots in the forwardline – from close to goal to pushing 60 – teams will find it hard to effectively close them off. It helps to render spares less valuable, and reduces the impact of tall defenders who peel off and help.

    Some teams get nervy about the accuracy drop that comes with shooting from deep, and there are some with tall targets (or effective enough set ups) to not need to stretch the defence further. For all teams not named the Bulldogs, fewer defenders where you want them to be is the goal.

    The Bombers have played one less game than most teams, and have faced significant injury issues through the year. But their most reliable bomb threat (Peter Wright) has been in and out of the team for various reasons over the last two years.

    If the Bombers are to rise up the ladder again, maybe they need to bomb more.


    Premiership windows

    Sean Lawson

    The “premiership window” has been a beloved content generator for the Fox Footy Couch for a number of years, and it’s pretty appealing, being a simple all-in graphic that shows which teams are good.

    If you haven’t come across it yet, this is sort of what it looks like.

    The idea here is incredibly basic – nearly all premiership teams finish in the top 6 for both scoring points, and conceding few points. The exceptions to this pattern since 2000 are the same two teams who are nearly always the exceptions to a premiership pattern: Sydney in 2005 and the Bulldogs in 2016. Both had low to middling scoring power.

    There are of course issues! The big one, for me, is the presentation of this chart as a set of rankings. Plotting by rank equalises the gaps between teams, stretching closely bunched teams apart and collapsing large gulfs between different teams.

    If we take exactly the same data as went into the above chart and instead just show the values directly, the difference is fairly clear.

    Immediately we can see which teams are being pumped up or underestimated by the ranking presentation.

    Collingwood and Adelaide currently sit a reasonable difference away from the pack, and instead we see a cluster of teams with similar figures both inside and outside the “window”. We can also see that the bad teams are quite a lot worse than everyone else!

    Of course, there’s a lot more statistics in heaven and earth, than are dreamt of in On The Couch’s philosophy, and some amateur analysts have added to the space by pulling together their own statistical measuring sticks for premiership contention that go beyond just reading the ladder.

    Friend of the site Andrew Whelan is a must read on this, measuring a whole series of aspects of footy use and defence in an easy to parse dashboard and scatter plot:

    On the offensive side are not just scoring and scoring shots, but various territory measures and possession chain measures.

    From this we can see that Adelaide and the Bulldogs are setting the pace across most metrics. We can also see certain other middling teams producing some dangerous characteristics, like GWS’ turnover scoring and Melbourne’s front half game.

    On the defensive side, it’s still the Crows shaping well, pointing towards a team quietly building the profile needed to succeed this year. Among the middling teams GWS defend turnover as well as they score from it, Essendon are doing very well with post clearance ground ball, and Sydney can hang its hat on a new defensive focus, being very hard to transition against.

    Intriguingly, Carlton appear to be still, somehow, stacking up quite well in many of these metrics, especially on the defensive side. This adds yet another perspective to their struggles, pointing towards what many observers have found so frustrating about the Blues in recent years. Somehow the team manages to be much less than the sum of its often impressive parts, doing many of the right things and not getting results from them.

    As the run to finals heats up, it’s well worth keeping tabs on Andrew’s metrics to see how the race among the contenders is shaping.


    Around the Grounds

  • Round 16 2025

    Round 16 2025

    This Week In Football is a collection of some of the best in football currently outside the walls of AFL clubs or broadcasters. Each week a curated grab bag from regular contributors and special guests will provide insight into and beyond the game on subjects of their choosing. For more about our contributors, click here.

    Banner images by Polly Porridge of the True Bloods Podcast. Check out her other design work.

    Before the bounce

    And just like that, there’s only two months of the season left. As the nights get colder, the battle for finals gets hotter.

    Something else that is getting hotter is the seats of several coaches are getting warmer. After an offseason where only one coach stepped away (John Longmire) relatively late in the process, we could be entering a summer with several job opening across the league.

    One of these changes is already confirmed, with Port’s Ken Hinkley stepping away after the season and Josh Carr taking over. Several others, such as Carlton’s Michael Voss, North’s Alistair Clarkson, Fremantle’s Justin Longmuir, St Kilda’s Ross Lyon and Melbourne’s Simon Goodwin have been mentioned by fans or media as having some threat to their job.

    There’s a very real chance that most of these coaches will stay in their jobs, and most clubs will deny that there was any threat to their employment.

    Idle speculation is cheap, all around.

    There’s also a chance that conversations are being held about other coaches across the league. This job uncertainty adds an extra dimension to the final weeks of normal AFLM football for the year.

    This week in football we have:


    The Joe Daniher (or Buddy) replacement nobody suggested

    Jack Turner | The Back Pocket | TheBackPocketAU

    The Lions look ominous in their premiership defence, but the absence of an experienced key pillar is still notable

    I know I’ve been critical of trade discussion slop during the season, but this article has become topical this week despite my plans to keep it in the barrel until the season was over.

    Take two hypothetical key forwards. Both 26 years old, and have had many seasons interrupted by injury, including their most recent one where they only managed four games.

    The first player averages 1.79 goals, 4.5 marks and 5.1 Score Involvements over his 70 game career.

    The other averages 1.76 goals, 5.8 marks and 5.5 Score Involvements over his 108 game career.

    They each have a career high of six goals, and have kicked bags of five multiple times. 

    Who are you picking? The numbers probably sit slightly with Player Two, especially considering that on average the first player would kick just the one more goal per season than the second if they played a full 23 games.

    But if you missed out on the first one, you would likely be happy to take the second, wouldn’t you agree?

    So as you may have guessed, the second player is Joe Daniher – specifically at the point of his career when he left Essendon. He had only played four games that year and four games the year prior, never able to get his body right.

    Then he moved to Brisbane, kicked 46 goals from 24 games, and you know the rest of the story.

    The other player is forgotten Hawks forward Mitchell Lewis. Came back last year only to be felled by injury again, but his best has been clearly good enough – and he’s still only 26. Recently he has been back in the news as he has been eying a VFL return.

    This isn’t to suggest that Mitchell Lewis is the talent that Joe Daniher was. Daniher was a game breaker in a way that many key forwards struggle to be. But as the saying goes, “we can recreate him in the aggregate,”.

    Mitchell Lewis hasn’t played a game at any level since he ruptured his ACL against Geelong in Round 17 last year, in what was his first game back after a cartilage problem from a past partial ACL tear kept him out from Round 3.

    In the 2022 and 2023 seasons, despite managing just 15 games, Lewis tallied 36 and 37 goals, finishing runner-up in the Hawks goalkicking both years and averaging the most goals per game in the team.

    With Sam Mitchell and the Hawks courting Oscar Allen, and with Calsher Dear and Mabior Chol already making that forwardline their own, you wonder if there is any room for a fit Mitch Lewis in 2026 anyway.

    Brisbane have somewhat of a recent history of getting players bodies right, with Joe Daniher the obvious example, but even Lincoln McCarthy – despite unluckily getting injured in their premiership year – strung together five full seasons at the Lions having never played one at Geelong.

    The Lions have looked intimidating at times this year, and short of firepower or accuracy in front of goal at others. Logan Morris is starting to come into his own as a key forward, but is a little more one-dimensional and less crash and bash than Lewis can be and Daniher previously was.

    This may all be a different story if Brisbane instead get Oscar Allen this year, as is now being rumoured more and more as the season goes on, but there is another club who could use a replacement key forward – for both structure and marketing purposes. That team is the Sydney Swans.

    Sydney’s forwardline has been their weakest link since Buddy left, with a combination of injuries and form preventing any of Logan McDonald, Hayden McLean or Joel Amartey from really stamping their authority over it, with the Swans forced to throw key defender Tom McCartin back at times this season.

    Pairing a (hopefully) fit Mitch Lewis with a slightly less wayward Joel Amartey would make for an imposing forward pairing, and might be what gets the Swans to take that final step in 2026.

    Now this might all be pointless if Hawthorn don’t land Allen or chase another key forward in the off season this year, or Mitch Lewis may simply want to try a change of location in an attempt to get his body right – either way, don’t be surprised if Mitch Lewis finds himself a new home in 2026, or at the very least has his name come up in discussions during trade week.

    Until then, lets just hope that Lewis gets through this weekend of VFL unscathed.


    What goes around comes around (once in a blue moon)

    Lincoln Tracy | @lincolntracy

    One of the much talked about inequities of the AFL fixture is who plays who twice, and when they do so. For example, Carlton has played both West Coast and North Melbourne twice in their 14 games so far this season, while Geelong didn’t play either team until Round 12 (when they played the Eagles).

    Here’s a list of teams that have played each other twice to this point of the season, prior to the start of Round 16:

    Brisbane and Geelong, Carlton and North Melbourne, Carlton and West Coast, Port Adelaide and Sydney, and the Western Bulldogs and St Kilda.

    Three of these pairs of teams had their second meeting in Round 15 (Brisbane/Geelong, Carlton/North Melbourne, and Port Adelaide/Sydney), but there was something about the Power and Swans game that caught my attention – and no, it wasn’t Joel Amartey’s abysmal night on the goal kicking front.

    Last week Sydney’s Justin McInerney put his side in front when he kicked the opening goal in the first minute of the match; a lead the Bloods would not relinquish for the remainder of the game. The Power got within three points partway through the second quarter but never got things back on level pegging (or held their own lead at any point during the game).

    Source: afl.com.au

    This is the opposite of what happened when the two sides met in Round 6, where Sam Powell-Pepper registered the first goal in the fourth minute. The Swans never held a lead at any point after this, although they did draw level with the Power in the first quarter, which I suppose is an improvement compared to the more recent game.

    Source: afl.com.au

    After looking at scoring chain and match result data for nearly 350 matches going back to the start of the 2018 season, I believe this is the first and only time this reversal of fortunes has happened during that particular period of time.

    The two teams will most likely take little notice of this incredibly useless finding, given Ken Hinkley and Dean Cox have bigger issues to deal with. Something to add to their summer reading piles, perhaps?


    Which clubs have a lot of player contracts expiring soon?

    Emlyn Breese / CreditToDuBois.com

    Player contracts have obviously been in the news a lot lately, particularly in the wake of Melbourne signing Kysaiah Pickett to the end of 2034.

    Using Footywire’s database of contract status I thought it would be interesting to look at how each list shapes up in terms of who is locked away and for how long.

    To the left, in the faded area, you can see how long a player has been on that club’s list. The right shows how far into the future they are contracted.

    Let’s also get a quick summary of who has the most potential fluidity in their list over the next few years.

    For this year, Port Adelaide and Collingwood have the highest proportion of their list unsigned.

    If we look forward to the end of 2026. Carlton, Port Adelaide again, as well as Hawthorn and West Coast all have 70% of more of their players yet to extend.

    At the three-year mark we’ve got Richmond, St Kilda, Carlton and Hawthorn with 90% of their list potentially out of contract by then, with the Bulldogs just shy.

    Going from the opposite direction Fremantle, GWS, Collingwood, and Brisbane have the highest proportion of players contracted out past the end of 2028.

    West Coast, Essendon, Gold Coast, Hawthorn, and Collingwood are the only clubs with no players contracted beyond 2030, with West Coast’s longest current commitments ending with Jake Waterman, Jack Hutchinson, and Liam Baker in 2029.


    Attacking off the mark

    Cody Atkinson

    If you watch enough footy on a weekend, you’ll likely hear the commentators implore players to attack quickly after taking a mark. Attacking instinct has always been envied in football, but the “stand” rule has seen some see attacking directly from marks as a priority.

    There’s a couple of quick ways this can happen. Teams can either look to play on immediately after marks, with the running finding space and ideally bouncing the ball before kicking, or they can look for either an overlapping or forward handball. This is an example of what the latter looks like.

    The concept is that decisive movement forward can catch the defence before it can settle, especially early in chains after intercepts or stoppage wins. Although the clip above didn’t end up in a score for Brisbane, it did give them a clear look inside 50 – about as good as you can get in modern footy.

    The second benefit is that it can often leave the man on the mark as a passenger in play, looking to cover off two different objectives without moving.

    Some teams look to attack this way more than others. TWIF have looked at how often teams handball directly or bounce from taking marks. 

    While a couple of very solid sides rely on this type of movement, two of the league’s teams to beat (Collingwood and Brisbane) sit near the bottom. This shows that instead of a universal strategy, it’s more situational. Too many overlap handballs can leave you exposed the other way if the subsequent use isn’t accurate. Unlike what is often discussed, handballing or playing on straight from marks is a “sometimes” activity.

    It also inherently takes away the biggest advantage of a mark – a pressure free disposal. Pressure on kickers has been shown to increase the likelihood of turnovers and reduce the accuracy of kicks. Players and teams need to be sure that the trade off is worth removing this advantage.

    Another angle to this is when attacking from marks lead to scores.

    Adelaide and Brisbane don’t go hard after marks as much as other teams, but when they do it comes off more of the time. By contrast Port Adelaide and Essendon probably go to attack too often based on their ability to score from these types of attacks.

    So what’s the lesson from all of this? Maybe it’s that there is more than one way to get the ball through the goals, and attacking all out isn’t always the right move.


    Which players love the tough conditions?

    Sean Lawson

    Following on from our look at weather impacted footy for the ABC, Emlyn suggested we have a look at individual player data related to the weather. It turns out there’s some poor schmucks have played in the muck much more than others. And some players go their best when conditions are far from ideal.

    The players who have played in the wet since the most since 2022 are mostly Crows players – namely those who have played in all their 16 rain affected games. But there’s one non-Crow on the top.

    Daniel Rioli’s move from Richmond to Gold Coast sets him apart from the rest. The Suns have played 5 games in the wet this year, to add to his steady diet of soggy MCG games in previous years.

    Rioli also tends to have a bit more impact in the wet, improving his average AFL Player Rating from about 12 to about 14. The picture of which players go best in the rain is just a who’s who of pretty good AFL players more generally, but Christian Petracca stands out as a genuine mud pig, having rated a little higher in the rain than even Marcus Bontempelli since 2022. 

    Many of the top players are skilled or powerful midfielders, but two relatively mobile big men in Luke Jackson and Tim English also stand up in the rain. Jackson, in fact, is one of the biggest wet weather improvers overall since 2022, behind only the surprising name of Jake Lever whose player rating in wet games goes to 14.5 against 8.9 on other occasions.

    Living up to their hydrophilic club mascot’s identity, two battling Swans talls, Hayden McLean and Aaron Francis, also seem to have a knack for impacting plenty in the rain.

    At the other end of the scale, a number of very skilled forward half players and some other more traditional rucks historically fail to impact as well when there’s rain around.

    As far as heat goes, Murphy Reid has started brightly at Freo and stands out as having played nearly half his games this year in temperatures hitting above 25 degrees. Suns and Dockers players dominate the list of players who have spent the largest share of their games in the heat, and the Suns completely monopolise the list of most games played hot conditions.

    As noted in the ABC article, hot weather games tend to lend themselves to open running as pressure and defensive running gets harder to maintain. The list of players to improve the most in these conditions tends to be a list of players who benefit from finding some space to create and attack in.

    Finally, in cold weather, the biggest improver is Bulldogs runner Jason Johannisen. Amusingly, there are a number of Brisbane players who show large increases in performance in the cold weather.

    Perhaps, with Tasmania on the horizon, a few of these cold-weather Lions might consider a move southwards.


    Around the Grounds

  • Round 15, 2025

    Round 15, 2025

    This Week In Football is a collection of some of the best in football currently outside the walls of AFL clubs or broadcasters. Each week a curated grab bag from regular contributors and special guests will provide insight into and beyond the game on subjects of their choosing. For more about our contributors, click here.

    Banner images by Polly Porridge of the True Bloods Podcast. Check out her other design work.

    Before the bounce

    Peter Ryan at The Age has reported this week on a potential revival of State of Origin, but this time in Australian Football form. Yet again the thirst for seeing the best against the best has raised its head.

    Despite the Origin format of interstate football becoming ubiquitous in League over the years, the concept started out in Australian Football originally a few years beforehand.

    Since then Origin has become nearly bigger than the rest of league in this country itself, with its devotion to mates, states and mates going against mates who come from different states.

    There is also no Gus Gould to set the mood in Australian Football.

    ‘The statement she made is in its narrow sense true, but also in a broader sense impossible, it defies history and the future at the same time, it asks us to challenge our own senses of what is expected of us in life, and isn’t that the beating core of football? After the break we return to ORIGIN’

    Liam Hogan (@liamhogan.id.au) 2025-06-11T06:19:16.459Z

    But AFL administrators have seen the impact of Origin on the slightly differently shaped ball game, and the broadcasters have taken note of the ratings.

    One of the big issues is which states should get a call up for the game. Ryan’s report notes that WA and Victoria have been tabbed for a potential 2026 game, leaving South Australia and a strong Allies side in the cold.

    More important is the timing and potential rewards for playing. Pride only gets you so far in an increasingly professional environment. A preseason game may not drive the level of competition the rugby league origin game drives.

    Whatever the case, we may soon have an even longer men’s AFL season ahead of us.

    This week in football we have:

    The AFL’s Sightseers and Homebodies

    Jack Turner | The Back Pocket | @TheBackPocketAU

    Why has Harvey Thomas maxed out his frequent flyer card in just 32 games?

    Earlier this year, there was a much discussed stat about the fact that GWS youngster Harvey Thomas has played at 13 venues in just 32 games, surpassing Scott Pendlebury’s 11 venues in just his 23rd game. Harvey Thomas is a long way off league record holder David Swallow, who has played at 22 venues in his 245 career games. 

    That’s a record that may be equalled or surpassed by Nick Holman, Jarrod Witts or Touk Miller should the Tasmanian Devils still join the competition in the 2028 AFL season.

    But what is the reason for this? Is it simply Vic bias and the fact Collingwood never travel? Or is there something else at play here? 

    Well, the easiest way to do this is to break down the grounds that Harvey Thomas has played at and why.

    Harvey’s Giants already spread their games across two unique stadia – Manuka Oval in Canberra and Sydney Showground in Olympic Park – while their cross town rivals play at a different ground all together (the SCG). That’s three without leaving the confines of NSW/ACT.

    You can tick off the other major stadiums pretty easily, with the MCG having four major tenants, Docklands having five major tenants, and Adelaide Oval and Perth Stadium having two each. This means every team will play at each of these grounds once a year. Thomas, already a mainstay at the Giants, only missed three games in his debut season. All up, that’s seven grounds without breaking a sweat. Add the Gabba once every year and a half (on average) and that’s eight.

    It is perhaps worth mentioning that Scott Pendlebury too has played at all seven of the grounds listed above in the past two seasons and also at Carrara. Harvey Thomas is yet to play there as the Suns home game against GWS was during Gather Round last year, but we’ll get to that in a moment.

    Now we start to get to the fun part – the ‘bonus’ grounds. Where do we find the four (now five) extra grounds that Harvey Thomas has played at to surpass Scott Pendlebury so fast?

    Well, first up was the aforementioned Gather Round game against Gold Coast. Fair or not, the clashes between smaller clubs are less likely to be played at Adelaide Oval, and the Giants and Suns clashed at Summit Sports Park in Mt Barker last year. This year they faced the Saints at the oddly shaped Norwood Oval.

    Here’s where we get to the sticky part. Some teams – much like GWS – are in the habit of selling home games to regional cities to help generate a little more profit than ticket sales alone can create, but they don’t want to sell their games against Collingwood because they make the big bucks. Why sell a profitable home game when you can sell one that might struggle to break even? 

    Collingwood are the Bulldogs highest pulling home game, while the Giants are their second lowest. This is why Harvey Thomas has now played in Ballarat against the Dogs and at York Park against North Melbourne. 

    The last remaining ground on this list is Kardinia Park in Geelong, where Harvey Thomas has already played twice – for two wins I might add – while Pendlebury has never played there. While many – including myself – think that Collingwood should have to make the trip down the highway at least every second year, (and I can’t believe I’m saying this) there’s a few good reasons why he hasn’t yet. Geelong only play nine or ten home games at Kardinia Park, with the remaining home game/s held at the MCG. The Cats have requested to play the MCG games against large sides – this year Hawthorn, but with Collingwood getting the nod in many years. Collingwood also has a deal for 14 guaranteed MCG games a year expires, it is a no brainer that in seasons where they clash twice, Geelong will continue to host Collingwood at the MCG.

    So is it Victorian bias? Or simply a case of luck? Arguably it’s a bit of both – or neither. Even last year – in a season where they were historically poor – one of the most travelled teams in the country in West Coast only played at eight different stadia, the only difference to Pendles being that they had to play in Geelong.

    The real answer here is that as long as the poorer clubs continue to sell two or three home games a season, the smaller interstate teams and other poorer clubs will continue to play games at more grounds than their opponents.

    Goal kicking isn’t one of the most under-rated stats, but it’s maybe one of the most poorly analysed

    Emlyn Breese / CreditToDuBois.com

    This article makes heavy use of the excellent wheeloratings.com by Andrew Whelan for this piece (and many other pieces). If you’re not familiar you should go have a look, it surfaces a lot of things that will help you understand the game far better than official league stat offerings.

    Goal kicking, eh?

    Last week for the ABC Cody and Sean poured some much needed cold water on the supposed goal-kicking crisis. More articles followed this week and, apart from the aforementioned, surface level would be a generous description of them.

    Goal accuracy = goals / shots. It’s a simple proposition and attractive because of it. However, like many simple explanations it misses more than it hits.

    I’ve instead measured teams goalkicking performance based on three different attributes:

    • Volume – how many shots is a team generating per game
    • Quality – on average, how high quality are those shots (xScore per shot – xScore is a measure of how many points on average you would expect a given shot to result in by comparing it to similar shots taken previously. A set shot from the goal square would have an xScore of almost 6, a shot under physical pressure from the boundary might have an xScore of under 2.)
    • Execution – is a team making the most of those opportunities (total score / total xScore)

    It’s my tentative view that execution is largely chance based rather than a quality of a given team. Over the past 5 seasons the only team to not record seasons both in the negative and positive is Fremantle. Last year Melbourne were above average in executing while this year they’re abysmal. If you’re going to be weak in one thing you want it to be this because it doesn’t represent a structural problem.

    I’ve then grouped teams on overall performance in these categories:

    • Elite – overperforms in at least two of the categories
    • Poor – underperforms in at least two of the categories
    • Strength outlier – A mixed bag, but defined most clearly by a strength
    • Weakness outlier – A mixed bag, but defined most clearly by a weakness
    • Average – Teams who neither overperform or underperform majorly in any given category

    Some interesting things jump out right away.

    Geelong and the Dogs excel on all metrics. If you need another excuse to hop on their premiership chances, this will help you get there.

    By contrast Adelaide’s quality of shots is lagging a bit. Gone are the days of Tom Lynch or Josh Jenkins getting endless passes out the back to an undefended goalsquare. These “cheapies” have been made up for by volume of shots and maximizing the chances they do take.

    Collingwood’s attacking strength has been predominantly the volume of opportunities they create, with fairly average quality and execution.

    Gold Coast and North Melbourne are both generating their shots in really dangerous places. The difference between the finals fancy and the Roos at the bottom of the ladder is North’s lack of supply – which continues to be a critical problem.

    St Kilda and Hawthorn don’t have a real strength or weakness and hit around average on all three measures.

    GWS and Carlton’s execution has been strong through the year, making up significant ground in their attacking space. Fremantle’s quality of shots has covered a similar role for the Dockers.

    Brisbane are creating a lot of shots at a decent quality. But so far this year their execution has let them down. If their execution lifts they could easily click into another gear coming into finals.

    Melbourne are abysmal at executing on their shots, by far the biggest outlier of any metric by any team.

    Sydney’s quality of shots generated is the biggest thing letting them down. This may have to do with the lack of targets they’ve had up forward for much of the year.

    The bottom six has several predictable tales. Essendon are executing well enough on the shots they generate. Execution is Richmond’s strongpoint relatively but still below league average. West Coast is underperforming on all three metrics.

    We can also apply a similar method to looking at the shots a team concedes. For this one I’m not going to use a three-axis chart, as (in my view) a team has little control over the week-to-week accuracy of their opponent. What is replicable for a team’s defence is how many shots it concedes and where it concedes them.

    Collingwood are clearly the best defending team in the league – outperforming in both restricting the quality and volume of their opponents shots. Carlton are the clear next in line.

    Adelaide and Gold Coast are quite similar – doing quite well in restricting the volume, but around average for constraining those shots to low quality ones. GWS and Essendon are the reverse but moreso – elite for restricting their opponents to low quality shots, but they do allow a lot of them.

    The Dogs and Melbourne can restrict the volume of shots to some degree, but the ones they do concede are dangerous.

    Finals chasers Hawthorn, Fremantle and Brisbane are above average on both axes.

    While at the other end of the scale is West Coast. They are the Melbourne of this chart, a clear outlier that stretches the axis.

    Cooling it all down

    Cody Atkinson

    The last two weeks of footy have seen something that’s usually experienced by players and fans amplified to an extreme

    While footy is meant to be a winter game, the combination of a surprisingly cold start to winter and the perplexing scheduling of two night games in the coldest AFL cities in the country have led to a couple of notably low scores. Sometimes the scoreboard lies about the quality of a game, but both last week’s Hawthorn-Adelaide match and round 13’s game between GWS and Port were scrappy affairs.

    Don’t just take my word for it.

    “We haven’t played a lot of night games here and…I’m sure you saw on the bench there was fair bit of steam coming off the heads of the players and things like that.” Hawthorn coach Sam Mitchell said after the match in Launceston.

    “So it was obviously colder than we’ve played. So it was a beautiful day absolutely ma magic um day here today but obviously the temperature drops quite steeply with no cloud cover,”

    “It meant that it was going to be slippery and I thought both teams, I thought, handled it really well early…I think it was the conditions that led to the low scoring.”

    “I think both teams – it was slippery you know. It’s dewy obviously – there’s there’s no doubt it

    was a slippery wet game. So that’s a challenge when it comes to finishing your work off.” Adelaide coach Matthew Nicks added.

    Wet weather gets talked about a fair bit, with a return to first principles and 80s style footy often getting sprinkled amongst more established game plans. Focus around the contest and straight line movement comes back into play, and the ground tends to get “skinny” and long.

    We will get to what that looks like later.

    Cold weather footy gets talked about a fair bit less. That makes sense – we see a lot less of truly cold conditions here given the general climates of where the games are played. It can often be hard to work out why there are issues. In Canberra the dewy surface was noticeable in person, but may have not come across on TV.

    “It wasn’t a pretty game of footy but it’s not a “pretty game of footy” weekend.” It was pretty slippery all over the place this weekend.” Port coach Ken Hinkley explained.

    “Of course you have to adjust to what you play (to) what the conditions are so, you know, it’s something we had to do.”

    When watching the game, one particular attribute came through clearly. That is how “skinny” the game was.

    Playing “skinny” is pretty simple – it generally refers to playing on the narrow side of the ground without looking to stretch through the corridor or the fat side by using horizontal handballs or kicks. Generally, skinny games are also accompanied by a “long” set up, with bookends sitting far deeper than normal to attempt to provide some vertical spacing.

    If you are watching in the stands or at home, an easy test is where the widest players are sitting when the ball is near the boundary. If the wing roles are sitting well inside the centrepoint of the ground, chances are that it’s a pretty skinny game.

    This is one example of Port’s set up when exiting 50 when in Canberra.

    Up the ground the Power crammed hard to the boundary. Another example comes at this midfield boundary throw in. Players are heavily concentrated on the ball, and no-one is sitting on the fat side of the ground.

    I asked Ken post-game about this

    “It seemed like you tried to play a pretty skinny game?” 

    “Yeah we did because the conditions made it a bit more challenging…that’s what was happening, I think, in the second quarter. We were throwing the ball around a little bit too much, boys were trying to probably fight through too much contest.” Hinkley explained. 

    For those who love data to back up the eye test, here it is.

    For the rest of the season, Port and GWS are the two sides most likely to use the corridor when transitioning the ball from their defensive third – or behind the back of the centre square. In Canberra, both sides avoiding doing so stringently, with the exception of the unsuccessful foray that Hinkley mentioned in the second quarter.

    The Hawthorn and Adelaide game last week saw both sides try the corridor more often than in Canberra, but there were other hallmarks of a modified style of game. The sides combined for 16 contested knock ons, well above their combined average of 10. There were also 183 intercept possessions – almost 60 more than the league match average of 128. There was also one passage where interchanges were stranded for about 10 minutes, kicking rotations right out, due to the ball being stuck on the “wrong” side of the ground”.

    By now you might have cottoned on that it sounds a bit like wet weather footy. It’s similar, yet different.

    But sometimes conditions are down to how you perceive them. I also asked GWS coach Adam Kingsley about the conditions in Canberra post game and he had a different view from my frozen fingers.

    Conditions play a bit of a factor with the ball movement?

    “Nope, it’s pretty dry out there I reckon. We may have made it look a bit wet at times but for the most part it was pretty good conditions.”

    Completing the Australian Football Hall of Fame

    Sean Lawson

    The Hall of Fame of Australian Football has an oft-discussed Victorian bias, with statistical analysis showing that, from before the national era, lower levels of achievement will lead to likely induction versus South Australian and Western Australian players.

    Initially dominated by Victorian journalists (the-13 person inaugural panel featured only SANFL president Max Basheer and Perth journalist Geoff Christian), the Hall started with 116 of 136 inaugural names having played substantially in Victoria.

    More recent years have seen some attempt to correct the record, with AFL chair Mike Fitzpatrick ordering a review in 2010 that led to a required 25% minimum of selectors living outside Victoria.

    The Hall then started to belatedly recognise early non-Victorian stars like Tom Leahy (notably an even match for Roy Cazaly at interstate carnivals) and in 2018, analysis by Daniel Hoevenaars and James Coventry in Footballistics showed that since the regime change, WAFL and SANFL nominations had kept pace with pre-AFL names from Victoria. 

    There has also been more effort to correct for the relative under-representation of eras before about the 1970s.

    Keen students of Australian geography will be aware that there are in fact more than three states in Australia. All of them have long football histories, and lost in a lot of the older debates about the relative merit of SANFL and WAFL players have been other worthy candidates across the full geographical sweep of Australian football’s century and a half of history.

    So, what of the Hall of Fame representation of the rest of Australia? What recognition has there been so far, and who might we look to for still-unrepresented regions of the footballing nation?

    For those looking for those overlooked Victorians such as Sav Rocca you have found the wrong article.

    Tasmania

    First up is Tasmania, clearly the fourth state among football states. Tasmanian VFL players Darrel Baldock and Peter Hudson were inaugural legends, and Ian Stewart joined them in the following year. Others like Roy Cazaly, Stuart Spencer and Ivor Warne-Smith developed later ties to the Apple Isle. Several players who began their footy journeys down south have been inducted into the Hall, including Terry Cashion, Verdun Howell and Laurie Nash. 

    It wasn’t until almost immediately after Fitzpatrick’s review when Tasmania finally had players inducted who hadn’t played in the VFL. Horrie Gorringe in 2010 and John Leedham this year are the only Tasmanian players inducted solely on the basis of their play in Tasmania. Several players, such as Cashion, almost exclusively plied their trade down south. Of the states outside the big three, Tasmania possibly is the best represented and needs the smallest correction.

    New South Wales

    The New South Wales Australian Football Hall of Fame features 10 legends in its ranks.The majority of these legends had extensive careers in the AFL/VFL or elsewhere, such as Tony Lockett, Paul Kelly and Terry Daniher, but it also features several names from earlier eras.

    Haydn Bunton Sr is notable in this list of NSW Hall of Fame Legends, because to read the national Hall of Fame Legends entry his career simply starts at age 20 already at Fitzroy. This is despite Bunton having been rather famously the subject of an illegal payments scandal to get him there at all. He played several senior seasons at Albury and West Albury (both former incarnations of the current Albury Tigers) from age 15 until age 20, and won the only premierships of his career there.

    The entry of NSW Hall of Fame legend Ralph Robertson in 2024 arguably broke the duck for NSW footy excellence being recognised on its own terms. Robertson did play 14 games for St Kilda in 1899, but his Hall of Fame case was built on the strength of his contributions to footy in Sydney. Robertson played for East Sydney (now merged into the UNSW/Eastern Suburbs Bulldogs) and North Shore, and represented New South Wales on several dozen occasions. Longtime Swans chair Richard Colless, himself a legend in the NSW Hall of Fame for football administration, publicly lobbied for this inclusion for years. 

    Figures such as leading goalkicker Stan Miller (the namesake of their Coleman), administrators Harry Hedger and Jim Phelan (the Best and Fairest in AFL Sydney is the Phelan Medal) and long term player and administrator Jack Dean may hear their names called in future years. 

    There is also a solid case for the induction of Sir Doug Nicholls, who grew up in New South Wales. While his career was only 11 years long he was successful at both VFL and VFA levels, including representing the VFL and VFA sides in representative matches.

    Queensland

    The Queensland Hall of Fame only has two playing legend – Marcus Ashcroft. The premiership Lion already naturally sits in the national Hall for his exploits at AFL level. Many other Queenslanders also sit in the current national Hall of Fame, such as Jason Dunstall, Jason Akermanis and Michael Voss.

    The lone QAFL-specific entry in the Hall of Fame comes, strangely enough, in the form of an umpire. Tom McArthur umpired 502 games from 1959 to 1985.

    Dick Verdon has arguably the strongest case of the Queenlanders to stay up north to make the national Hall in coming years. 

    Northern Territory

    Neither territory yet has a truly standalone entry in the national Hall of Fame, though there are several players with ties which go unmentioned in the AFL website’s honours lists.

    Curiously, Michael Graham’s long career with St Mary’s is listed alongside his Sturt career, but several other inductees like Maurice Rioli and Bill Dempsey do not have their games for St Mary’s and Darwin listed.

    In the NT Hall of Fame, among the inaugural legends are two Indigenous Team of the Century players, Bill Dempsey and David Kantilla. They played for West Perth and South Adelaide respectively. Rather notably though, both spent substantial parts of their careers playing in the NTFL during the southern off-season. That’s something that’s rather unique to footy in the Top End, and would be worthy of note by a truly national Hall of Fame on cultural significance grounds alone.

    There’s also a wide range of other notable NT players that merit consideration alongside Dempsey and Kantilla.

    The ACT

    Finally, let’s talk about the nation’s capital.

    The most famous name in Canberra football is Alex Jesaulenko. Jezza played in Canberra until age 20, winning three senior premierships with Eastlake before making the move to Carlton, something that is (unsurprisingly) omitted from his Hall of Fame record. His story of migration and only taking up the game at age 14 is well known, but also significant is that he did this on the mere fringes of what could be reasonably considered football heartland. Jesalulenko also returned to Canberra to play and coach after his retirement.

    Among several AFL Canberra Hall of Fame legends (and the strange omission of both James Hird and Jesaulenko) are two names I want to highlight as potential national Hall of Fame candidates based on Canberran exploits.

    The first is Kevin “Cowboy” Neale. Neale was part of St Kilda’s only VFL premiership and played 256 games for them. He’s probably not quite in the frame for Hall of Fame honours on his St Kilda career alone, especially with the over representation of players from his era already.

    However, his contributions to football in Canberra after this were also significant. While serving as captain-coach at Ainslie, he led the Tricolours to four flags in five years, kicking about a million goals in the process. 

    He also led Canberra to this most storied of moments:

    Against a VFL team featuring plenty of legitimate VFL talent such as Malcolm Blight, Merv Neagle, Robert Dipierdomenico, Francis Bourke, Michael Turner and Trevor Barker, Neale led a Canberra side also featuring Jesaulenko, to a hard fought win at Manuka Oval in July 1980.

    If there’s one historical moment worth commemorating in a century of Canberra footy, it’s this moment, and captain-coach Neale was its architect.

    The second name is Tony Wynd, who dominated football in the ACT in the 1980s and early 1990s. As a junior he was selected in national All-Australian sides from junior carnivals, he naturally won a stack of Mulrooney Medals in the ACTAFL and just generally seems to have been about the most dominant player on record in the league among those who never played VFL or similar football.

    What else is notable, though, is that he was also playing to a level that got him selected to represent Australia in a tour of Ireland in 1987, though he subsequently broke his leg and missed out on the tour. As the AFL Canberra entry for his Legend status notes:

    Injury prevented Tony from playing in the All-Australian Representative team which toured Ireland and the United States in 1987. His selection was widely recognised as he was one of very few players from outside the major Australian football league teams to ever be named in an All-Australian team.

    Could Wynd have played successfully in a more credentialled competition in another state? Who knows? He appears never to have considered it. Wynd had a career in the ACT outside of football, working for ASADA’s predecessor, the ASDA and can be found in publications of the era promoting the anti-doping message.

    This highlights a significant problem with trying to assess things like the Hall of Fame in an era before professionalisation and mass media. In the late 1980s and 1990s, the level of pay across senior football competitions would not have made chancing the move interstate a financially appealing prospect for someone already holding a well-paying job such as one in the public service. Indeed, the average AFL salary didn’t pass the average full-time male salary for workers in general until around 1991.

    Wynd, then, represents something of the end of the unknowable hinterland of football talent – players plying their trade well outside the big leagues before professional money and recruiting made talent identification and recruitment all but inevitable. There are probably dozens of  former players out there like him from the pre-modern eras of football, who dazzled onlookers in their own leagues, but played out careers well beyond the spotlights in Melbourne, Perth and Adelaide.

    AROUND THE GROUNDS

  • Round 14 2025

    Round 14 2025

    This Week In Football is a collection of some of the best in football currently outside the walls of AFL clubs or broadcasters. Each week a curated grab bag from regular contributors and special guests will provide insight into and beyond the game on subjects of their choosing. For more about our contributors, click here.

    Banner images by Polly Porridge of the True Bloods Podcast. Check out her other design work.

    Before the Bounce

    Winter is here. The goals aren’t.

    Last week saw eight games of footy and approximately eight goals across an entire round.

    As winter falls on the football fields the goals tend to dry up, but not normally to this extent. No team scored more than 81 points in a game, a (non-COVID) record since decimal currency (probably).

    But overall, the footy was…enjoyable? We had four games decided by less than two goals, and all bar one by four goals or less.

    Already it is looking more like an anomaly rather than a long term trend, but it still warrants a little more attention than normal in coming weeks.

    This week in football we have:


    Are the finalists set?

    TWIF survey

    According to the writers of This Week In Football (and Ricky Mangidis of the Shinboner and Len Phillips of the internet) it might not be far away.

    Six teams were locked into the top eight the mid-year survey. Eleven teams were nominated across the 13 voters, with eight teams clearly ahead of three sides garnering some interest.

    This aligns with how the computer models complied by Max Barry’s Squiggle see the season playing out from here. There seems to be a gap opening up between Fremantle in eighth and GWS in a projected ninth.

    Some voters saw this uniformity as “pretty boring” but sometimes the boring option is the right one. But there’s still a fair amount of footy to play out.

    Interesting, no voter nominated Sydney to make the finals despite their recent history of making late charges towards finals.

    Contributors were also asked about the SPOONRACE, and it was even more straightforward, with twelve votes for West Coast and one for Richmond.


    Clang a gong, we are on

    Emlyn Breese / CreditToDuBois.com

    Last week over on CreditToDuBois I wrote about the three-year clangiversary of Hawthorn setting the record for most clangers in a match.

    I wanted to provide a bit of a broader overview of the clanger. We have data on clangers going back to 1998. Ted Hopkins, who co-founded Champion Data, is the one who popularised what has since become an integral part of the footy lexicon.

    I’d wager however that many of us (and even many broadcasters and journalists) don’t have more than a general sense of what a clanger is, so let’s bring out the virtual whiteboard.

    Now, how many clangers happen per game?

    If you look at just the numbers you’ll see a massive uptick in clangers since 1998. I don’t have a definitive answer on this, but I strongly suspect this is partly due to improvements in data capture and categorisation. Some of those actions above weren’t collected in the early days of Champion Data.

    We can see that since 1998 the average clangers per game has tripled. If we move to the second slide we can see that free kicks have stayed relatively stable, while other sources of clangers have grown significantly.

    From 2021 onwards we can see that the majority of clangers are disposals gone awry.

    We know what a clanger is, and we know how often they occur, but we haven’t addressed the key question – do they matter?

    Let’s look at the profiles of winning teams from 1998 onwards: 

    We find that over the last 5 years, a lower clanger rate (clangers / disposals) is a meaningfully better win predictor than a positive disposal differential.

    Having a lot of clangers doesn’t necessarily mean you’re performing poorly – some of the best players in the league frequently top the count. What matters is why you’re getting them – is it because you’re getting a lot of the ball, or is it because you’re being far less efficient with it than your opponent.

    Before we get to our top (bottom?) list, let’s take a quick look at the clanger profiles of each team.

    And finally, here’s the 20 worst clanger counts, clanger differentials, and clanger rate differentials


    Surprises all around

    TWIF survey

    The league may have separated into groups at the top and the bottom, but that doesn’t neccessarily mean it is who we thought it would have been at the start of the year.

    This Week In Football contributors were asked which teams had surprised them the most this year, and which had disappointed.

    Reflecting the evenness of the league and of pre-season expectations, a wide variety of teams were nominated.

    The most surprising side according to the voters has been the top 4 aspirant Suns, with the rise of the Crows and re-rise of Collingwood also causing some surprise.

    Reflecting that “surprising” doesn’t just mean unexpectedly rising up the ladder, Richmond also got a couple of nods.

    “Richmond are way ahead of where I thought they’d be. In hindsight, you can probably point to them still having a useful experienced defensive core as a starting point, but 3 wins is probably 2 more than what I’d have thought their best case scenario would be to this point.”

    The voter who chose the Dogs provided a solid explanation for the surprise:

    “I thought they were going to find their depth wanting and battle to perform with a coach who was distracted by his contract issues and an interpersonal style that isn’t necessarily for everyone.”

    A much stronger consensus emerged on the question of who has disappointed observers.

    One voter provided a clear description of the disappointment.

    “For knowing exactly what their flaws were but doubling down on largely the same ball movement patterns of the last few years.”

    Roughly half went for the Blues, who after widespread expectations of taking a theoretically strong list to the next level, are floundering on the very limits of finals possibilities.

    North Melbourne managed to disappoint a couple of respondents even against their own low expectations, while other likely September spectators like Sydney and Port Adelaide also got nods.

    One can only assume Collingwood being disappointing was a nomination by someone hoping to see them fail.


    How is footy going, and what we’d change about it

    TWIF survey

    Turn on the radio and the panel shows and some weeks you’d be convinced FOOTBALL IS IN TROUBLE.

    Well, maybe its time to shoot the messenger instead.

    This Week In Football contributors were asked about the state of the game in the survey, in an open ended format. Despite the lack of direction, 12 of the 13 respondents either directly or indirectly mentioning that the game is in a good state or as good as it has been.

    The thirteenth didn’t criticise the quality of the modern game, but said that the game wasn’t good enough to sustain the ever extending season.

    The good current balance between attack and defence was raised by several writers, with one saying:

    “There’s reasonable balance in attack and defence, the best players are shining through, and a nice amount of tactical and strategic variation.”

    Another added:

    “(The game is) in a decent sweet spot balancing ball use and contest work. The best teams can do both, and those who can only do one or the other get punished fairly regularly.”

    A clear focus of some was on the off-field side of the game.

    “The on-field product’s as good as it’s ever been but the off-field media slop is at a tipping point of sheer dogshit.”

    There’s also a common concern amongst footy media, fanatics and insiders that the amount of footy might be hitting saturation levels.

    There’s just way too much of it. Both from a media sense -which is pretty obvious and something you can block out – but even then 207 games is too many. Nine games a week is too many. It’s only one extra round but I reckon Gather Round has been a tipping point where the season becomes too long and games don’t matter as much as they should.

    Umpiring, rule interpretation and the MRO also came under the hammer.

    There are clearly some serious issues that need working out with the approach to MRO and umpiring consistency and interpretation though.

    So if the game is in a generally good state, albeit with some concerns, what would our contributors fix?

    Responses to this question were more specific to changes. A number of contributors suggested that the recent rule changes were a positive thing when talking about the state of the game, but others criticised their application.

    There was some questioning of the equalisation off field as well, with Hawthorn on someone’s chopping block.

    There was also a continued focus on needing to improve the understanding and decision making around tackling and prior opportunity.


    Who kicks it out on the full?

    Lincoln Tracy | @lincolntracy

    This is an excerpt of a longer piece I’ve written over on my blog, so please check out that version if you’re interested in this topic.

    The out of bounds on the full rule was first introduced in 1969, where – as the name implies – a free kick is paid against any player who kicks the ball out of bounds on the full. Since then, football games at every level are met by groans from supporters when a player concedes this type of free kick, whether it be from a rushed kick out of the back line that just carries over the boundary on the wing, or a crucial shot at goal that gets absolutely sprayed off the boot.

    But which player and team kicks it out on the full the most? And which games have seen the most balls end up in the crowd, instead of their intended location?

    In the 328 AFL games that have been played since the start of the 2024 season, there have been 1903 free kicks for out on the full against 541 players. There have been 133 players with a single kick out on the full, 157 players who have kicked it out on the full at least five times, 15 players who have kicked it out on the full at least 10 times, and one player who has kicked it out on the full 15 or more times.

    That one player? Shai Bolton.

    I was surprised to see a number of these names on the list. Bolton and Izak Rankine were a little unexpected, given they aren’t always high-possession players (although the number of kicks a player has does impact the proportion of kicks that can go out on the full). Max Holmes has been touted as the best draft pick of the 2020s to date, while Hugh McCluggage and Jordan Dawson are arguably having career-best seasons.

    Based on the list above, you can begin to understand why the Brisbane Lions, Geelong, and Adelaide find themselves at the pointy end of the table in terms of having the most out on the full kicks. And despite Carlton’s trouble moving the ball in 2025, they don’t seem to have as much of an issue kicking the ball out on the full (got to celebrate the small victories, right?).

    Since the start of 2024 the most out on the full kicks by an individual player during a match is three, which has been done 10 times – most recently by Brisbane’s Zac Bailey against Adelaide last weekend (including two in the final quarter when the game was on the line). Other players to have three out on the fulls in a single game include Oskar Baker (Round 5, 2024), Brody Mihocek (R7 2024), Nathan Broad (R19 2024), and Jack Gunston (R6 2025).  

    I hope that, at the very least, this post makes for some interesting discussion with your footy-loving mates.


    Which players are overrated and underrated?

    TWIF survey

    Naturally, asking a bunch of footy analysts to indulge in some hot takery about players being overrated elicited a fair amount of caution. Most didn’t like the question at all, but a few of the braver souls took some shots.

    It’s probably worth recalling, too, the parable of Tyrese Halliburton, who was rather cruelly voted “most overrated” by his own NBA peers in April. He is now leading his Pacers into an NBA Finals lead against the Thunder, and is just two wins away from a ring (and a Finals MVP).

    The only player to be mentioned twice for either question was Ben King, noted for perhaps being a little one-dimensional.

    Several contributors identified midfielders who tend to catch the public eye. Nick Daicos, Jason Horne-Francis, Zak Butters, Sam Walsh and Patrick Cripps were all identified by someone as being perhaps a little too well-regarded.

    That multiple members of two spluttering midfields were mentioned is perhaps not a coincidence.

    Horne-Francis was mentioned for his defensive game and for his role causing Port to struggle to fit and balance their midfielders. Cripps was highlighted simply as very good at things that aren’t that valuable at present.

    Someone also didn’t appreciate the hype around Archie Perkins.

    In terms of underrated players, a lot of people simply mentioned someone from their own team, which means naming them probably identifies the respondent.

    Among non-homer answers were many midfielders in a neat balance against the focus on them in the overrated question. Among these underrated midfielders were the likes of Ed Richards, Noah Anderson, Tom Atkins, Ollie Dempsey and Josh Dunkley. Dunkley was rather poetically/hungrily described as doing “all the mise en place so the chefs can cook”.

    Defenders in the underrated mix were Connor Idun (balancing the focus in the AA team on Lachie Ash) and Ryan Lester.


    Which player would you want at your club?

    TWIF Survey

    It’s a juicy question. Out of anyone available in the league, which player would be the best fit at your club.

    We didn’t ask whether it was just for a year, or forever.

    That reflected the split in votes received for different players.

    Some of our voters probably recognise that the most valuable recruits are young players of proven value.

    Such players can provide potentially a decade of very good service to a club, helping move the dial on a sustained push to success.

    However, it turns out that what many of our seasoned and sober analysts actually want to experience is the short term joy of just seeing the best player in the league run around in your own colours.

    Nearly a third of all respondents want the 30 year old Marcus Bontempelli at their club over anyone else.

    Several contributors went for younger stars like Pickett and Daicos while some sought to fill specific needs like big forwards or inside midfielders, but really, it was all about the Bonk here.


    XScore Pissers

    Joe Cordy

    My favourite kind of game to watch is an xScore Pisser.

    They’re an opportunity to revel in the chaos of the sport, and the fact that a significant on-paper advantage is never truly safe from it just not being your day. 

    For those who are unaware, expected score (AKA xScore) is a measurement of goalkicking accuracy. Every shot in a game is compared to a sample of similar shots based on location and situation to get an xScore value based on the average amount of points it scores.

    For example, a shot that results in a goal 50% of the time, a behind 40% of the time, and a miss in the remaining 10% will have a value of (50% of 6) + (40% of 1) + (10% of 0) = 3 + 0.4 = 3.4 points. The total xScore for a match is the sum of every shot’s xScore value. 

    If you’ve ever felt a team was either squandering or capitalising on their chances more than usual, xScore is the measurement that’d back you up. 

    Since 2021 the current crop of amateur analysts have been able to record xScores for each match, and there have been two obvious takeaways:

    • Over the course of a whole season, almost every team will end up within +/- 3 points of their xScore per game. The few exceptions are teams who funnel a disproportionate share of their shots through a small number of exceptionally good or bad players.
    • Despite everybody regressing to the mean eventually, it has more variance week to week than virtually any other statistic. 

    The latter point is where chaos gets introduced, and you find your xScore pissers. 

    The xScore pisser isn’t a uniform type of game – rather there are several types of pisser to soothe the soul.

    Double Swing

    The classic of the genre is the double swing. When one team kicks well above their expected total, in perfect juxtaposition to their opponents wastefulness in front of goal.

    You can typically find a low-scale example of one of these every other weekend or so, such as Round 12’s perfect mirror match of Walyalup vs Gold Coast where the visitors triumphed 9.10.64 – 11.9.75 from xScores of 75.5 and 64.9 respectively.

    The really special games are rarer though. To see a proper swing not just between two teams, but two specific players both taking the lion’s share of their team’s looks at goal. 

    In Round 21 2021, in one of the few games able to be played in Melbourne that season, the top of the ladder – premiership favourite – Bulldogs took on 10th place finals hopefuls Essendon.

    The game, for the most part, played out how you’d expect: Bulldogs comfortably won KPIs like Inside 50s (60-39), contested possessions (127-108) and shots at goal (33-23), for an xScore finish of 114.6 – 76.5. This margin would see a team win the match 98.6% of the time according to Wheelo Rating’s model.

    The beauty and tragedy of football though is sometimes despite having the clear talent advantage across the field, you can find yourself relying on one tall idiot to put the points on the board.

    Both teams went in with one such idiot, with Josh Bruce and Peter Wright at the spear tip of either team’s attack. Josh Bruce, for his part, played a reasonable game: scoring 3.2.20 from 7 shots, and taking 7 marks (3 contested). Unfortunately for him and his team, his counterpart at the other end was performing alchemy. 

    Peter Wright turned the same number of marks, one more shot, and less favourable positioning into 7.0.42, his best goal tally to date. 

    Despite their domination of almost every other phase of play, the Dogs went down 12.12.84 to 15.7.97 for a 51-point swing from the expected margin. On their own Bruce and Wright combined for 27 of these. 

    None of that helped the Bombers a few weeks later trying to end their finals drought against the same opposition, where they finished 27 points below their xScore, with Peter Wright not registering a shot on goal.

    But a pisser is a pisser, and it made for one great night of chaos.

    Taking Your Chances

    The more common example is when one team, for one reason or another, simply cannot hit the final target. They can restrict their opponent’s chances, they can generate their own, but they can’t execute the only skill that determines the result.

    There’s one club that is consistently on the wrong end of these results, and one club that is almost as consistently the beneficiary. 

    Coming in to Round 16 2023 the Giants’ season was just barely hanging on to the hope of finals, sitting at 6-8 in 14th place. They had put together a bit of form winning 3 of their last 4, with the solitary loss being a single goal margin to Richmond.

    The Demons had been going strong across the season, but were coming off a 15-point loss to Geelong where they kicked 8.15.63 from an xScore of 75.2. 

    If they’d managed to just be not great in front of goals again they would likely have won reasonably comfortably, happy to simply secure four points. Instead they put on an all-time great display of not taking your chances

    Despite falling just 3 points short of their expected total from the week before, and holding their opponents to 7.5.47 from an expected 44.1, Melbourne put up 5.15.45 to lose by two points. The worst offenders were Pickett, Petracca, Viney and Sparrow who generated a scoreboard impact of 1.9.15 from an expected 38. 

    Nobody has benefited more from opposition inaccuracy since 2021 than the Giants, but this was their masterpiece.

    Deadeye Dicks

    The last and possibly most aggravating variation on the xScore Pisser for the losing team is when despite creating opportunities, and even making the most of them, your opponents completely forget how to miss for just one game. 

    There are a couple recent examples of this: Hawthorn finishing two goals above their xScore total of 83.1 against the Suns in Darwin, while also restricting their quality and quantity of opportunities to 70.6, but still going down to 104-96 being one. 

    The highlight of this subgenre that’s stuck in my mind since I watched it unfold however was the 2022 Anzac Day clash. 

    Despite coming into their marquee fixture with a 1-4 record against a more talented opposition, Essendon had virtually everything they could hope for to go their way. They won the arm wrestles of territory, possession, shots on goal, and even found an unlikely goal source in Alec Waterman putting up 4.1 for the day. 

    Despite a pretty meagre xScore total of 66.1, they managed to exceed it by 15.9 points for a respectable 12.10.82 final score. The only Essendon could’ve lost is exactly the way they did: with almost every opposition player making the most of their one opportunity, and a couple of centrepieces with golden boots.

    Collingwood finished on a total of 15.3.93, outperforming expectations by over six goals. They found eight individual goal-scorers on the day, the two obvious standouts being Jack Ginnivan and Brody Mihocek arguably playing the best games of their Collingwood career, as they combined for nine goals from ten shots. 

    The first entry in Macrae’s long history of being on the right side of fine margins, and in my opinion, still the funniest.


    Around the Grounds